
Filtern in Dashboards
Hier erfährst du alles rund um die Filter auf deinen Dashboards – vom Finden und Einstellen bis hin zum Zurücksetzen.
Mit Filtern schränkst du ein, welche Daten ein Dashboard zeigt: einen Zeitraum, eine Filiale, eine Warengruppe. Dieser Artikel erklärt die neue Filterleiste — welche Filtertypen es gibt, wie du sie bedienst und was die Symbole bedeuten.
Hinweis: Die neue Filterleiste wird schrittweise freigeschaltet. Wenn deine Dashboards noch anders aussehen, ist sie für dich noch nicht aktiv. Melde dich bei uns, wenn du sie früher haben möchtest.
Die Filterleiste
Die Filter liegen oben über dem Dashboard. Jeder Filter besteht aus einer Überschrift und einem Feld darunter.

Woran du erkennst, was gerade aktiv ist:
Was du siehst | Was es bedeutet |
|---|---|
Grün hinterlegtes Feld | Der Filter hat einen Wert und schränkt die Daten ein. |
Weißes Feld mit „Alle" | Der Filter ist leer und schränkt nichts ein. |
Roter Stern hinter der Überschrift | Pflichtfilter — ohne Wert läuft das Dashboard nicht. |
„Weitere Filter ›" | Es gibt zusätzliche Filter, die eingeklappt sind. |
Rechts oben liegen drei Schaltflächen:
Aktualisieren-Symbol — wendet deine Filter an und lädt das Dashboard neu. Sobald du etwas geändert hast, wird das Symbol türkis. Das ist deine Erinnerung: Die Änderung wirkt erst nach dem Klick.
Filter — blendet die Filterleiste ein und aus.
Drei-Punkte-Menü — enthält unter anderem Filter zurücksetzen. Damit gehst du zurück auf die Werte, mit denen das Dashboard startet.
Filter anwenden
Stelle die Filter ein, die du brauchst. Du kannst mehrere hintereinander ändern.
Klicke auf das Aktualisieren-Symbol (oder auf Filter anwenden auf dem Handy).
Das Dashboard lädt mit deiner Auswahl neu.
Deine Auswahl steht in der Adresszeile des Browsers. Du kannst den Link also kopieren und weitergeben — die Kolleg:innen sehen das Dashboard mit denselben Filtern.
Zeitraum wählen
Jeder Datumsfilter öffnet ein Fenster mit drei Reitern: Presets, Zeitraum und Erweitert.
Presets — die schnelle Auswahl
Fertige Zeiträume, nach Themen gruppiert: einzelne Tage, gleitende Fenster („Letzte 30 Tage"), laufende Perioden („Dieser Monat") und abgeschlossene Perioden („Vorheriger Monat"). Ein Klick genügt, das Fenster schließt sich danach von selbst.
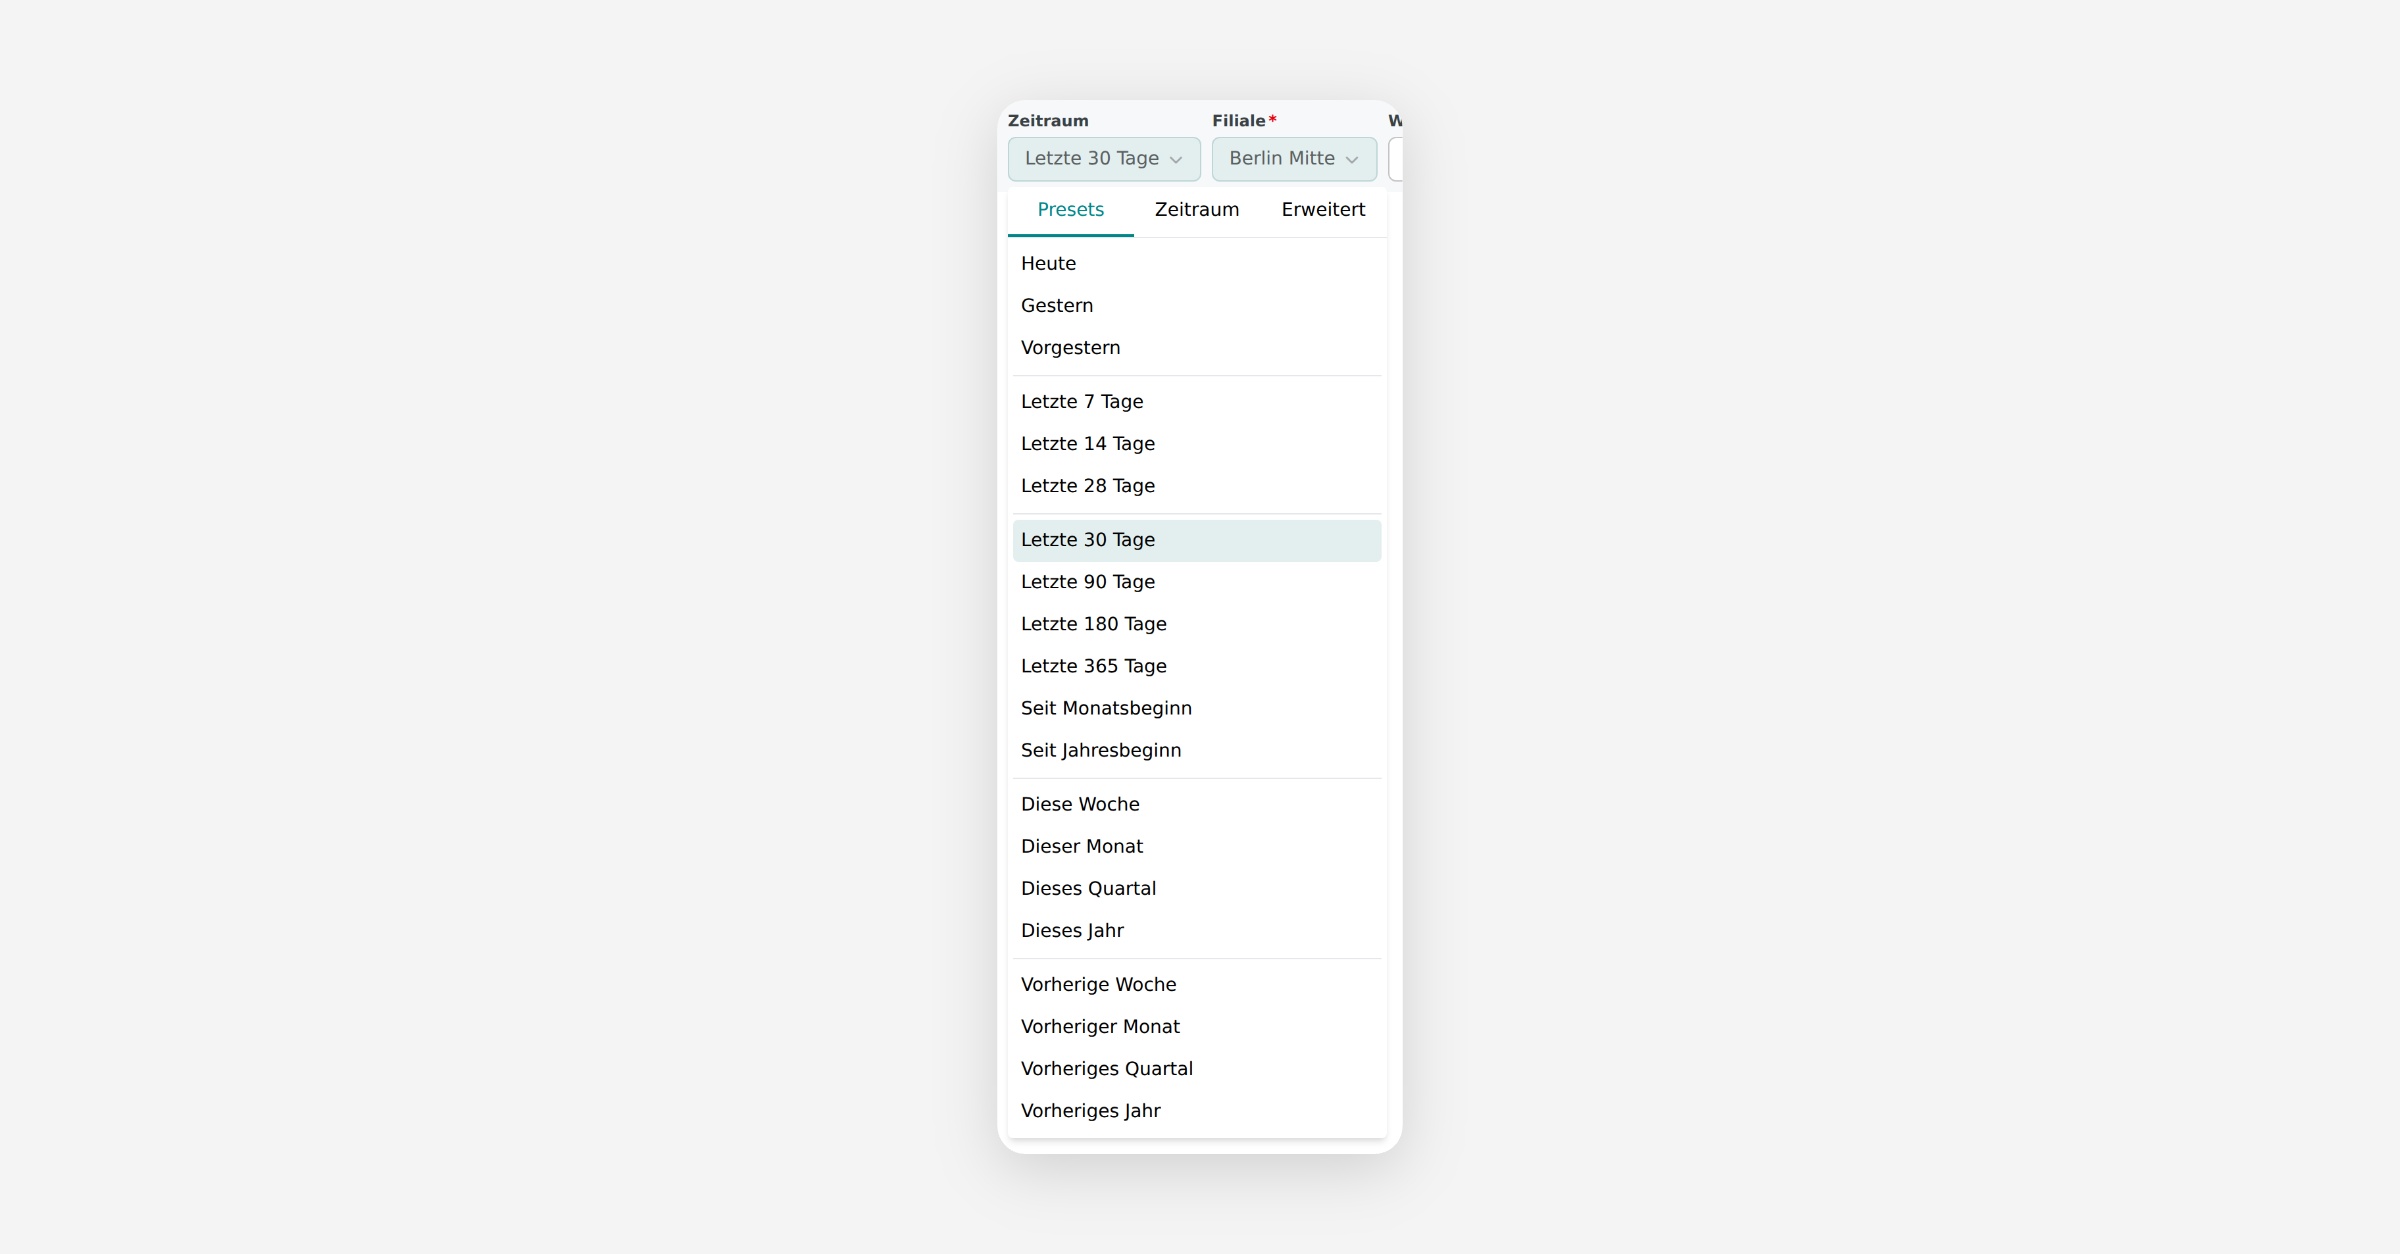
Der aktive Preset ist grün hinterlegt.
Zeitraum — feste Datumsgrenzen
Hier gibst du ein konkretes Von und Bis ein. Das Bis-Datum zählt mit — bei „01.07.2026 bis einschließlich 31.07.2026" ist der 31. Juli enthalten.
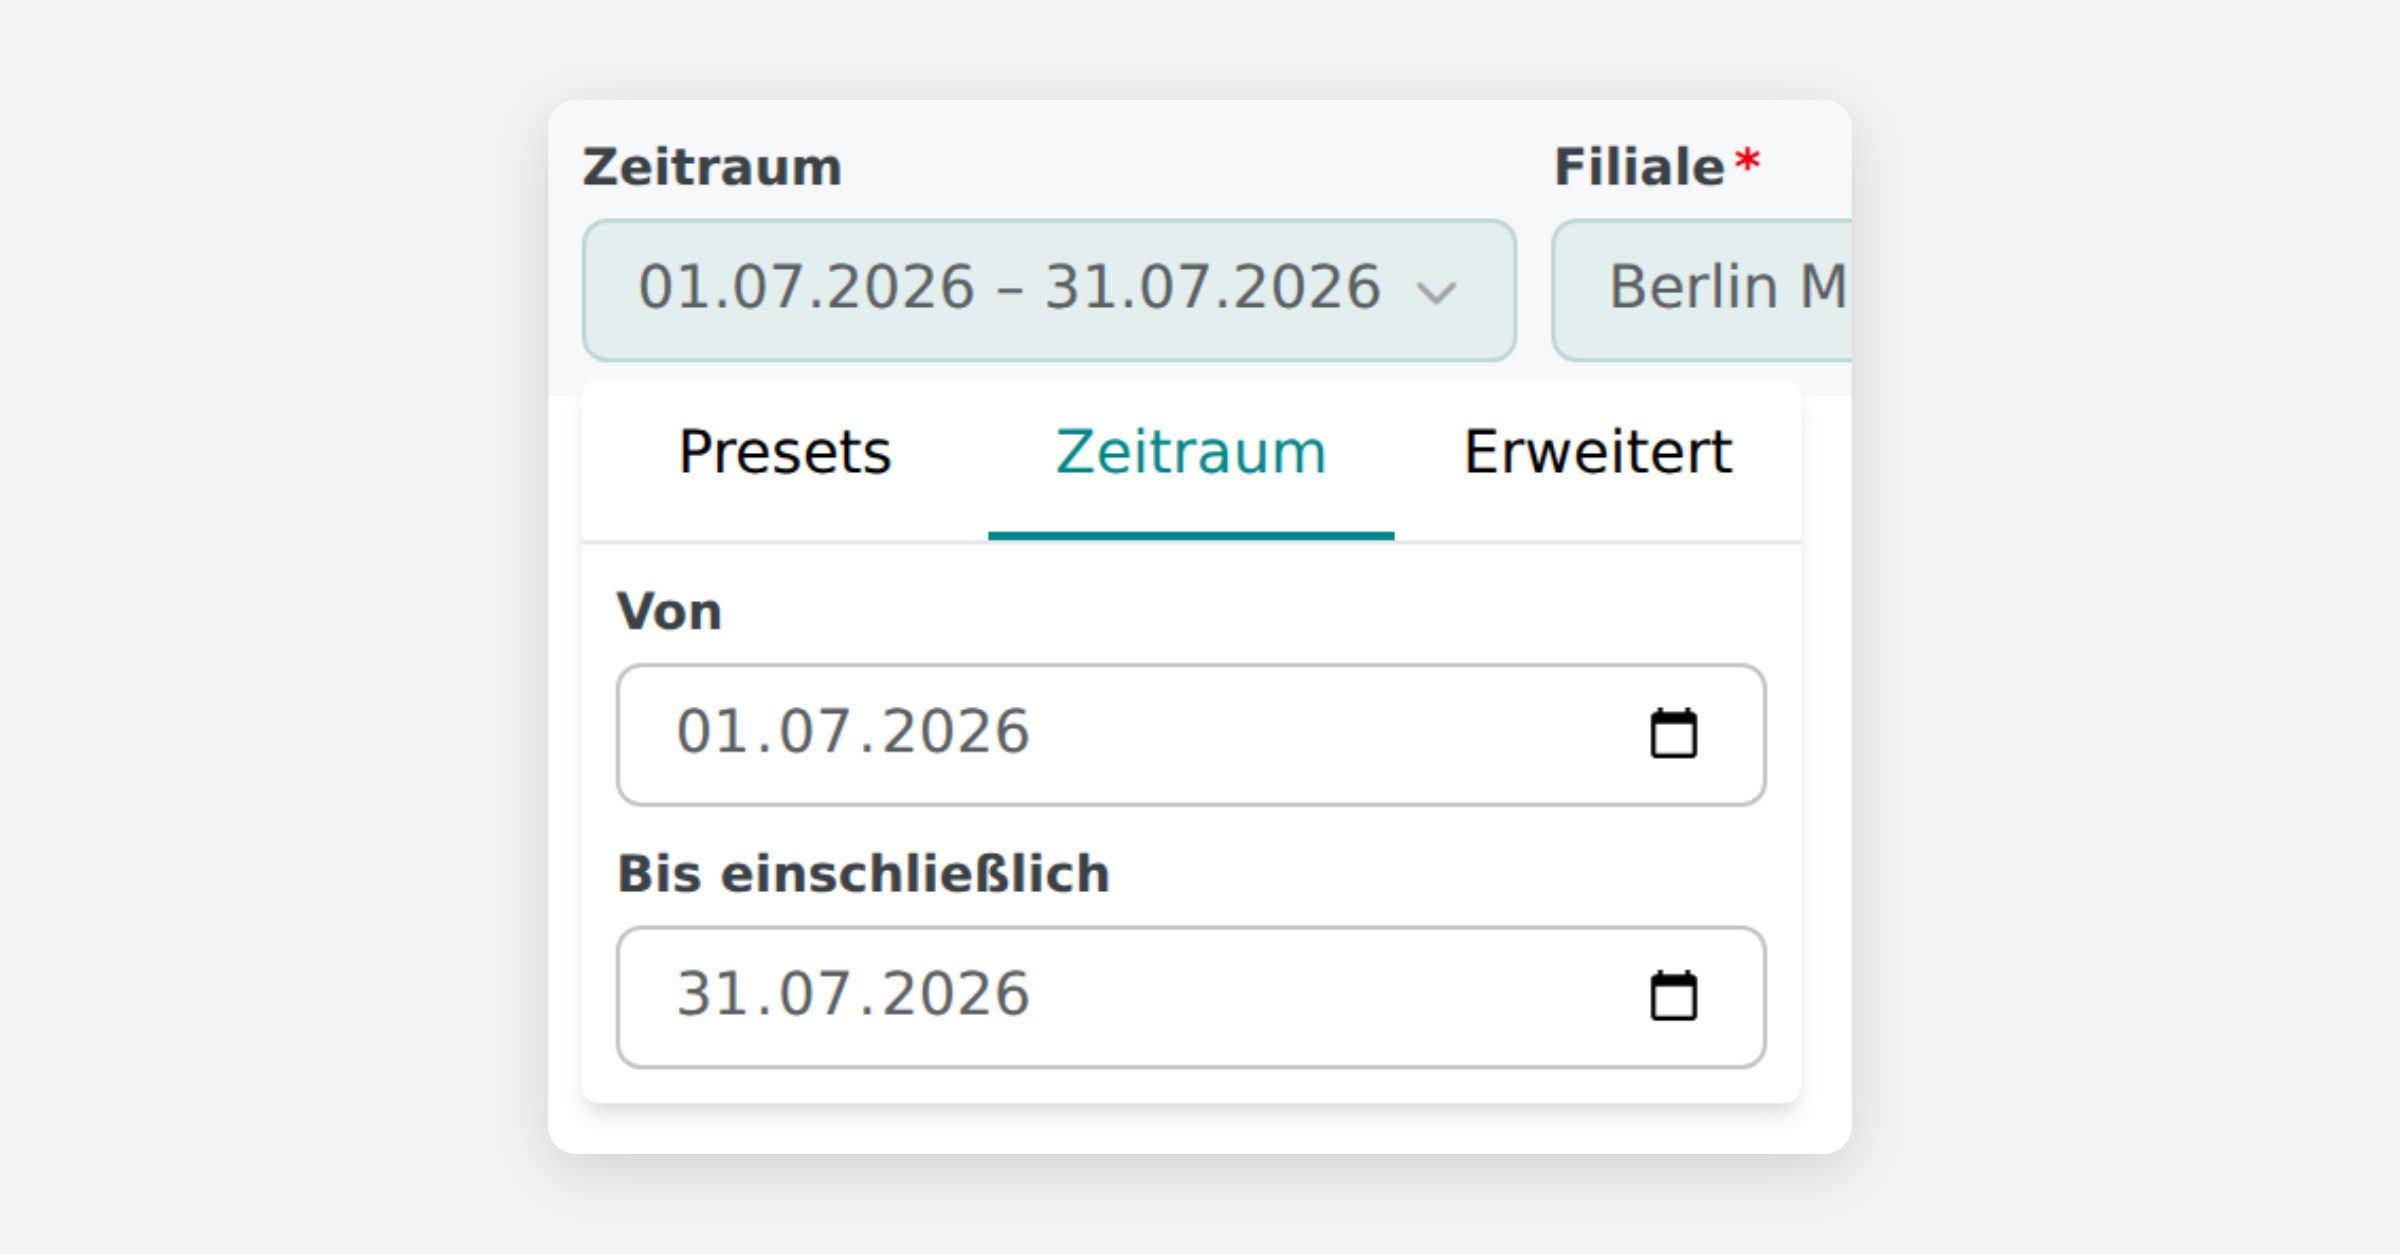
Zwei Hilfen im Alltag:
Nach der Auswahl des Von-Datums öffnet sich der Kalender für das Bis-Datum automatisch.
Liegt das Bis-Datum vor dem Von-Datum, zieht die Plattform das andere Datum mit — es entsteht nie ein leerer Zeitraum.
Erweitert — rollierende Zeiträume
Der dritte Reiter baut Zeiträume, die sich mit jedem Tag mitbewegen. Das ist die richtige Wahl für gespeicherte Links und für Reports, die regelmäßig verschickt werden.
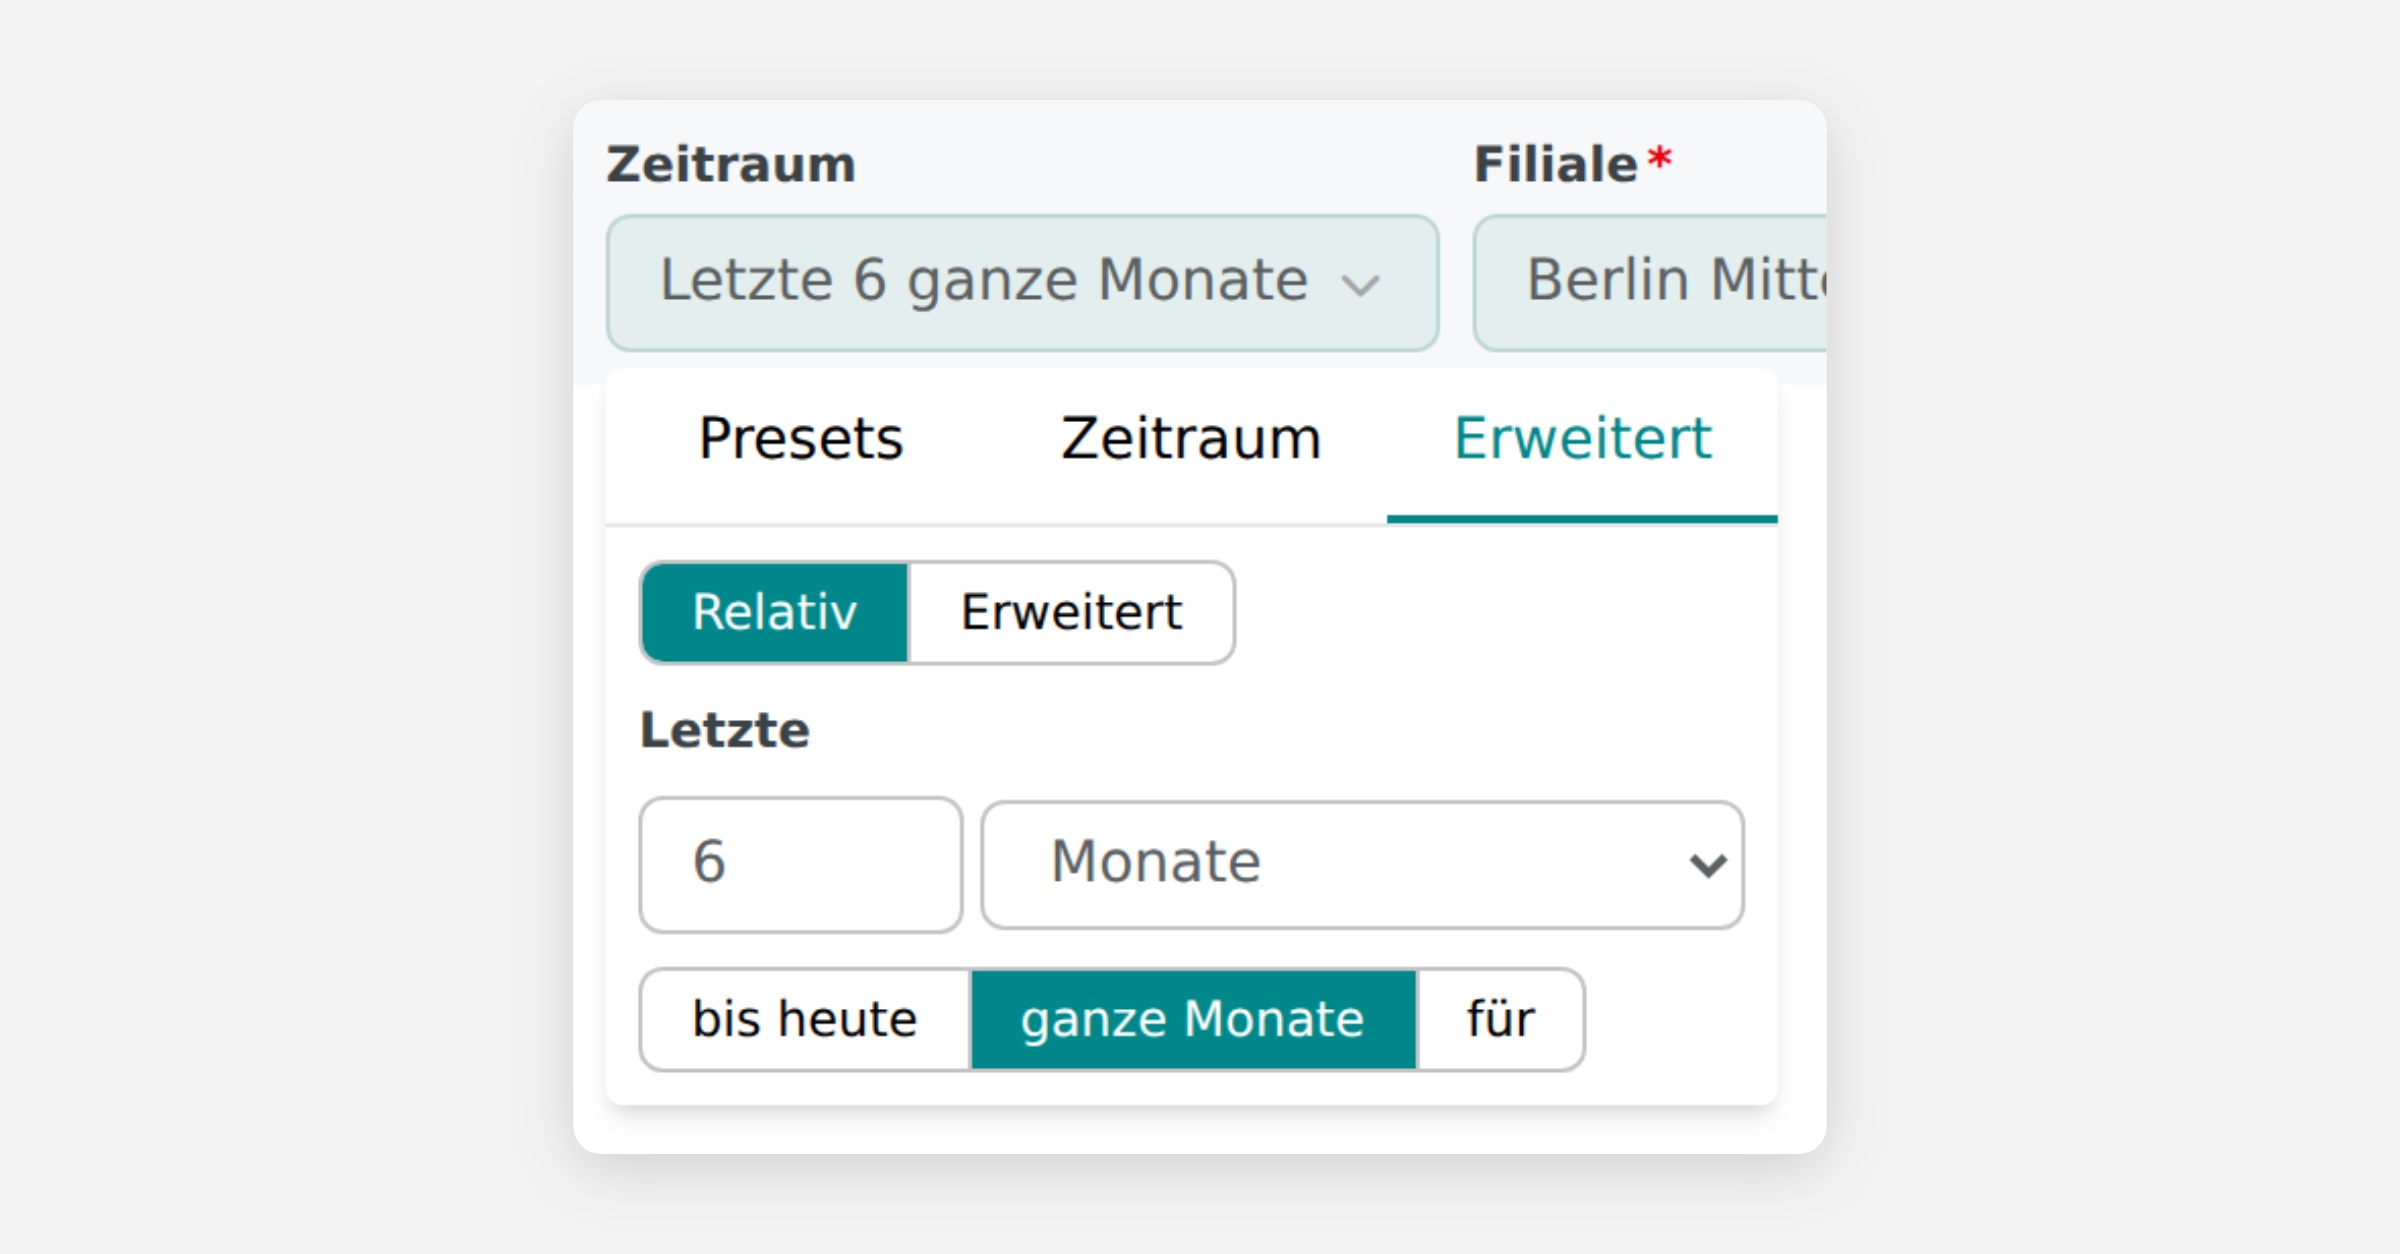
Du stellst eine Anzahl und eine Einheit ein („6 Monate") und wählst darunter, wo der Zeitraum endet:
bis heute — die letzten 6 Monate bis zum heutigen Tag, der laufende Monat also angebrochen.
ganze Monate — die letzten 6 abgeschlossenen Monate. Der laufende Monat bleibt draußen, das Ergebnis ist zwischen zwei Monatswechseln stabil. Die Beschriftung folgt der Einheit oben: bei Wochen steht dort „ganze Wochen".
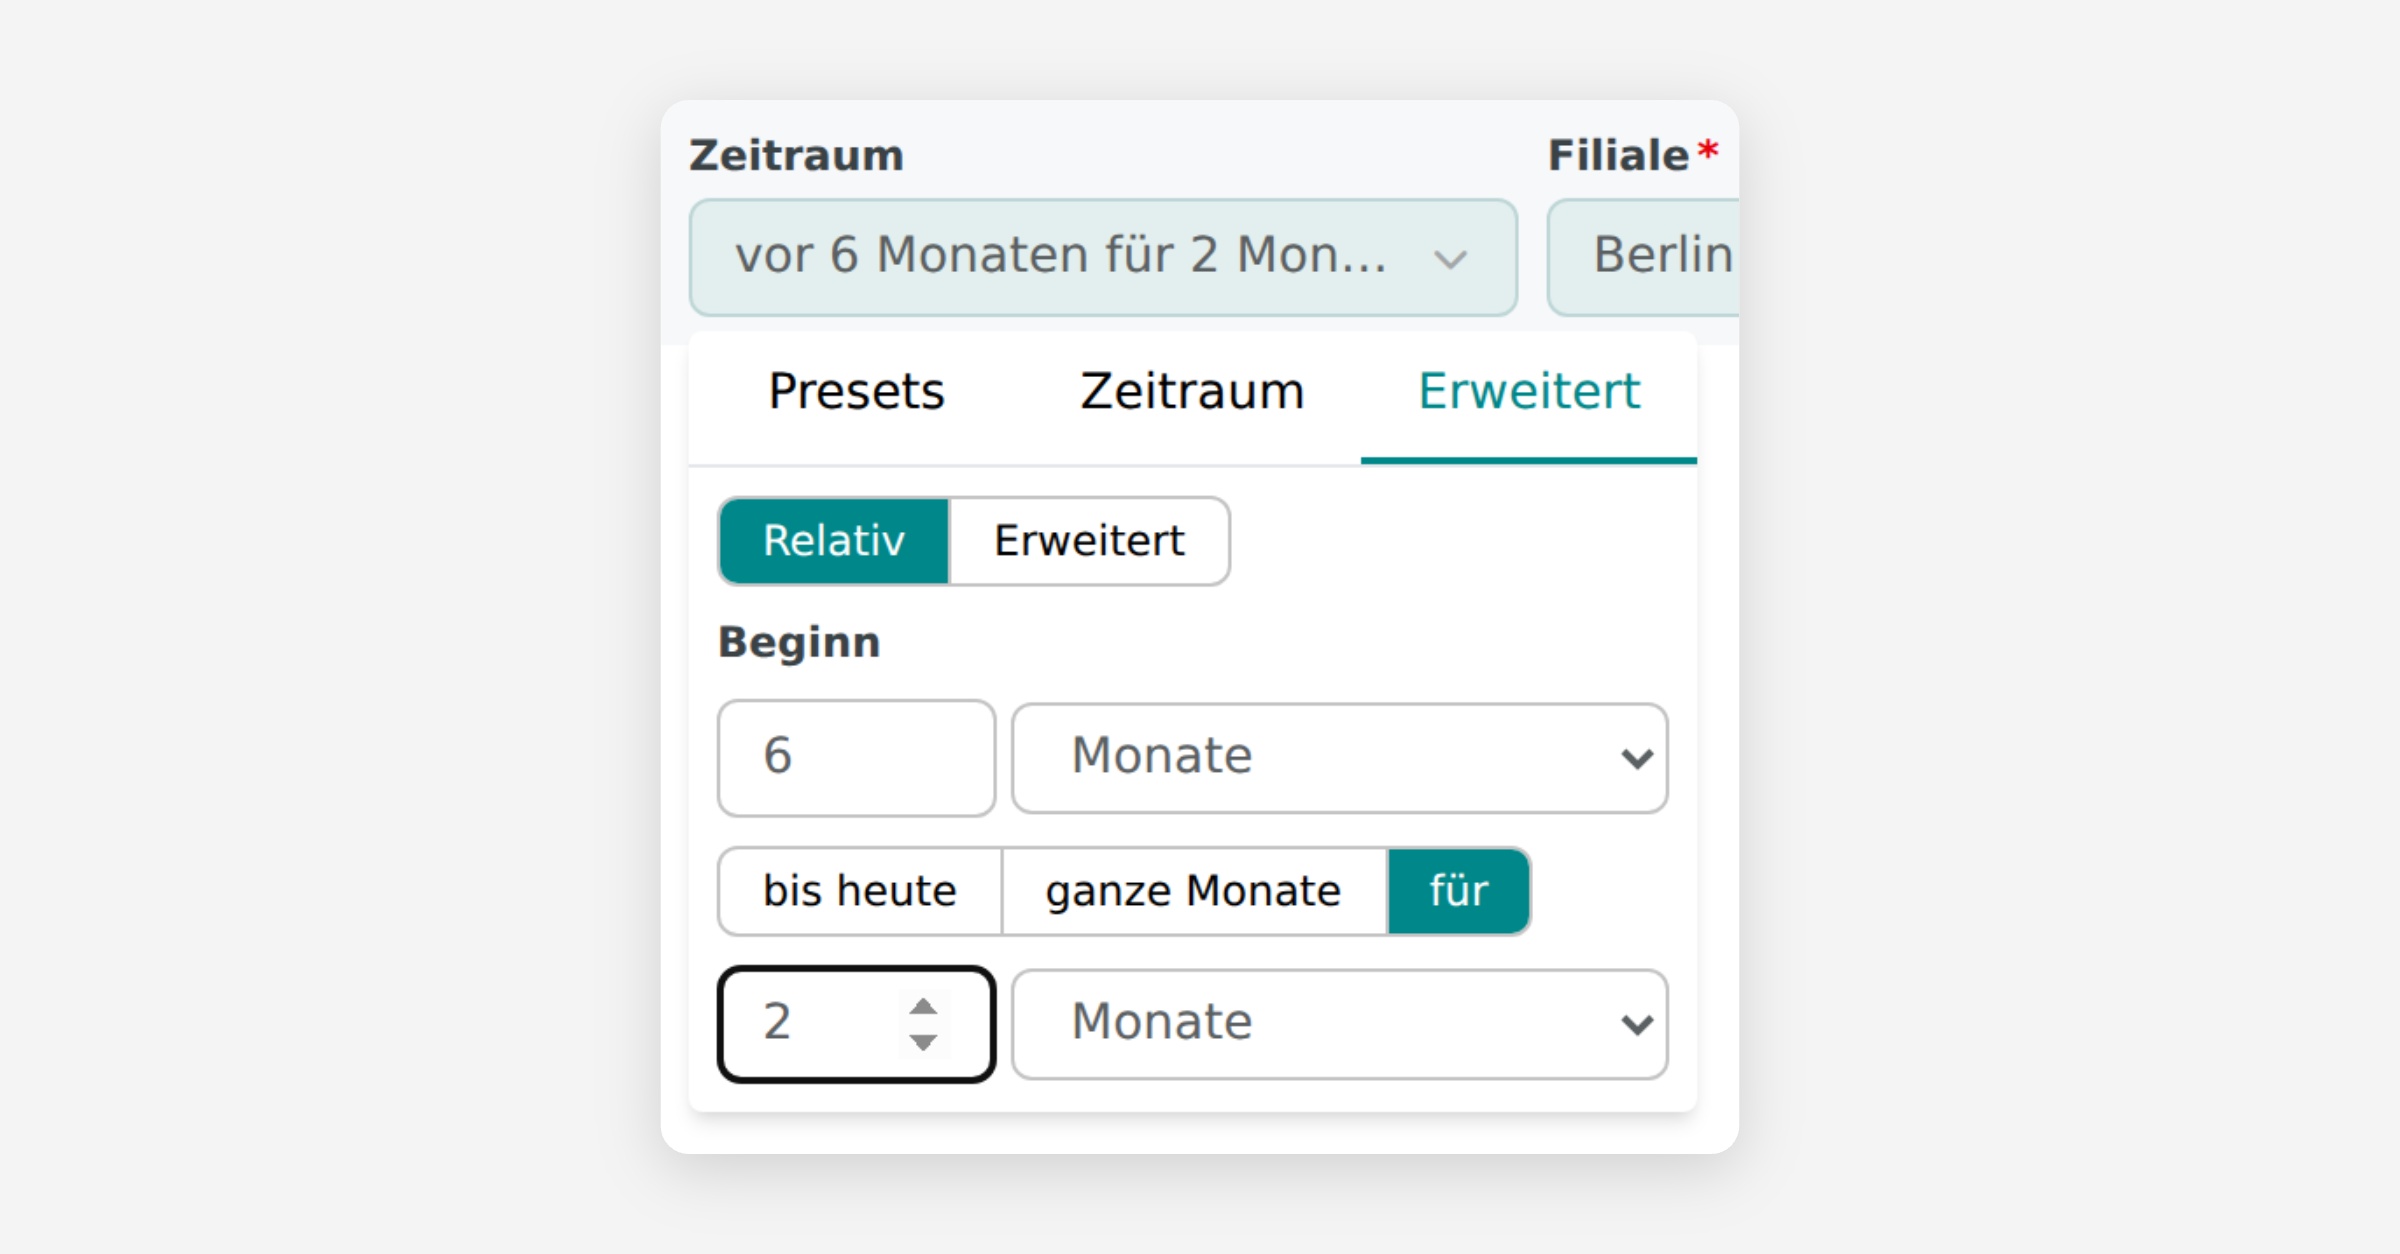
für — ein verschobenes Fenster. Oben steht dann Beginn: „vor 6 Monaten für 2 Monate" heißt, der Zeitraum beginnt vor 6 Monaten und dauert 2 Monate. Damit vergleichst du zum Beispiel denselben Zeitraum im Vorjahr.
Über dem Baukasten kannst du auf Erweitert umschalten und einen Datumsausdruck direkt eintippen — für Fälle, die der Baukasten nicht abbildet.
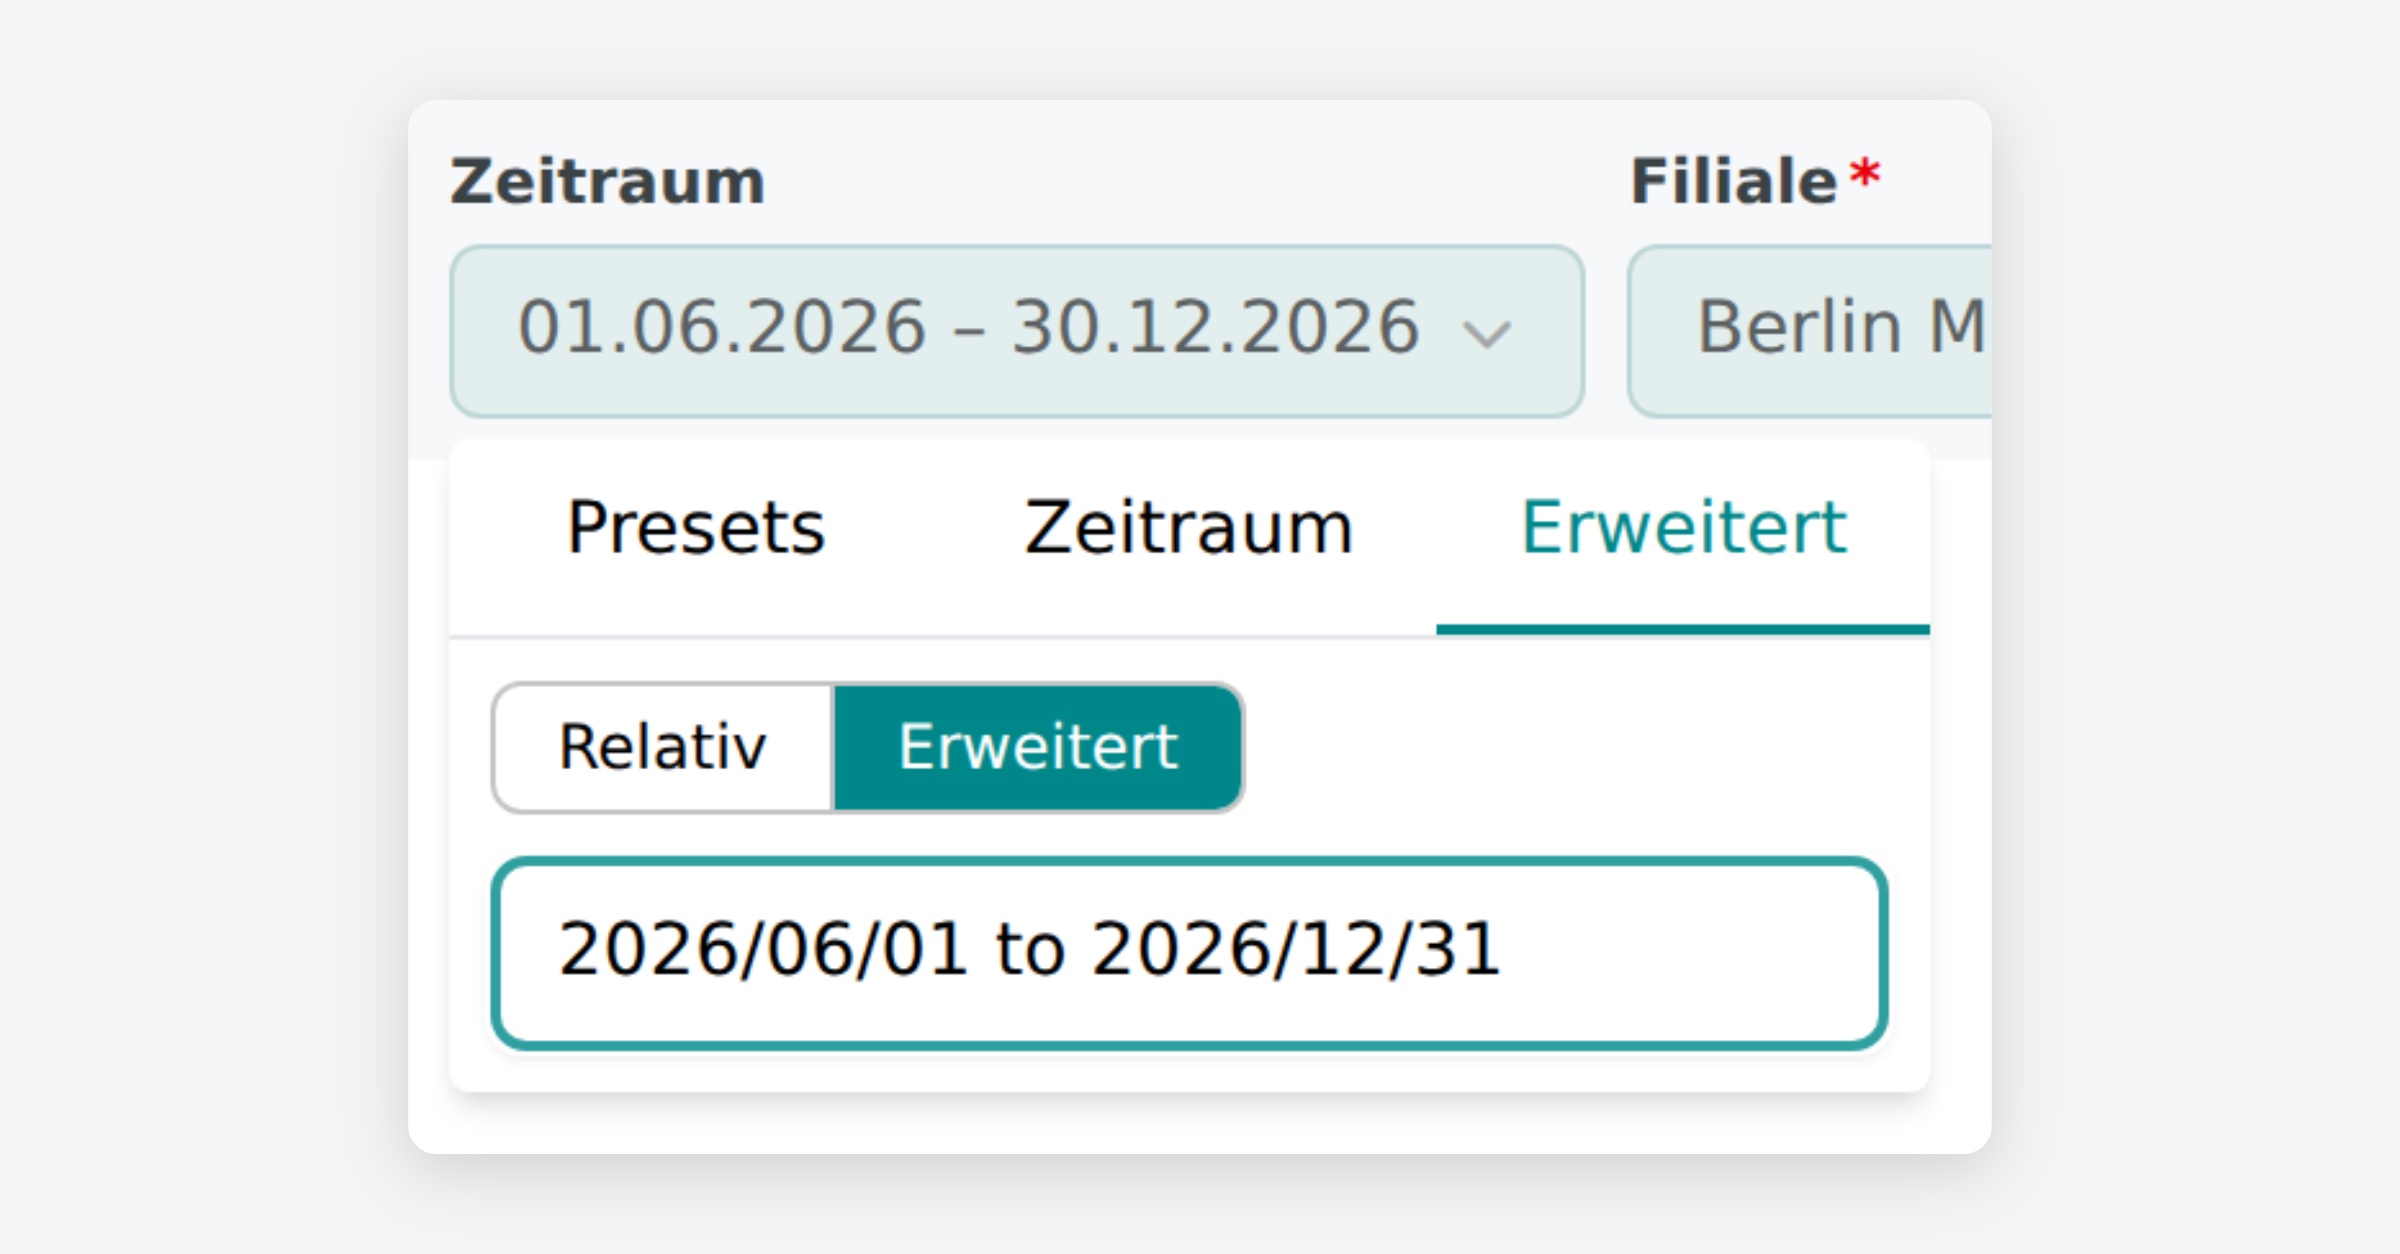
Nützliche Ausdrücke:
Ausdruck | Bedeutung |
|---|---|
| Vom 1. Juni bis 30. Dezember 2026. Das Datum nach |
| Vom Monatsanfang bis zur aktuellen Sekunde. |
| Alles vor dem 1. Januar 2026. |
Was immer du einstellst — die Schaltfläche über dem Fenster schreibt es in Worten aus („Letzte 6 ganze Monate"), damit du deine Auswahl auf einen Blick prüfen kannst.
Einfachauswahl
Bei einer Einfachauswahl gilt genau ein Wert. Kurze Listen stehen direkt im Fenster. Bei langen Listen gibt es zusätzlich ein Suchfeld: Tippe ein paar Buchstaben, und die Liste lädt passende Werte aus den Daten nach.
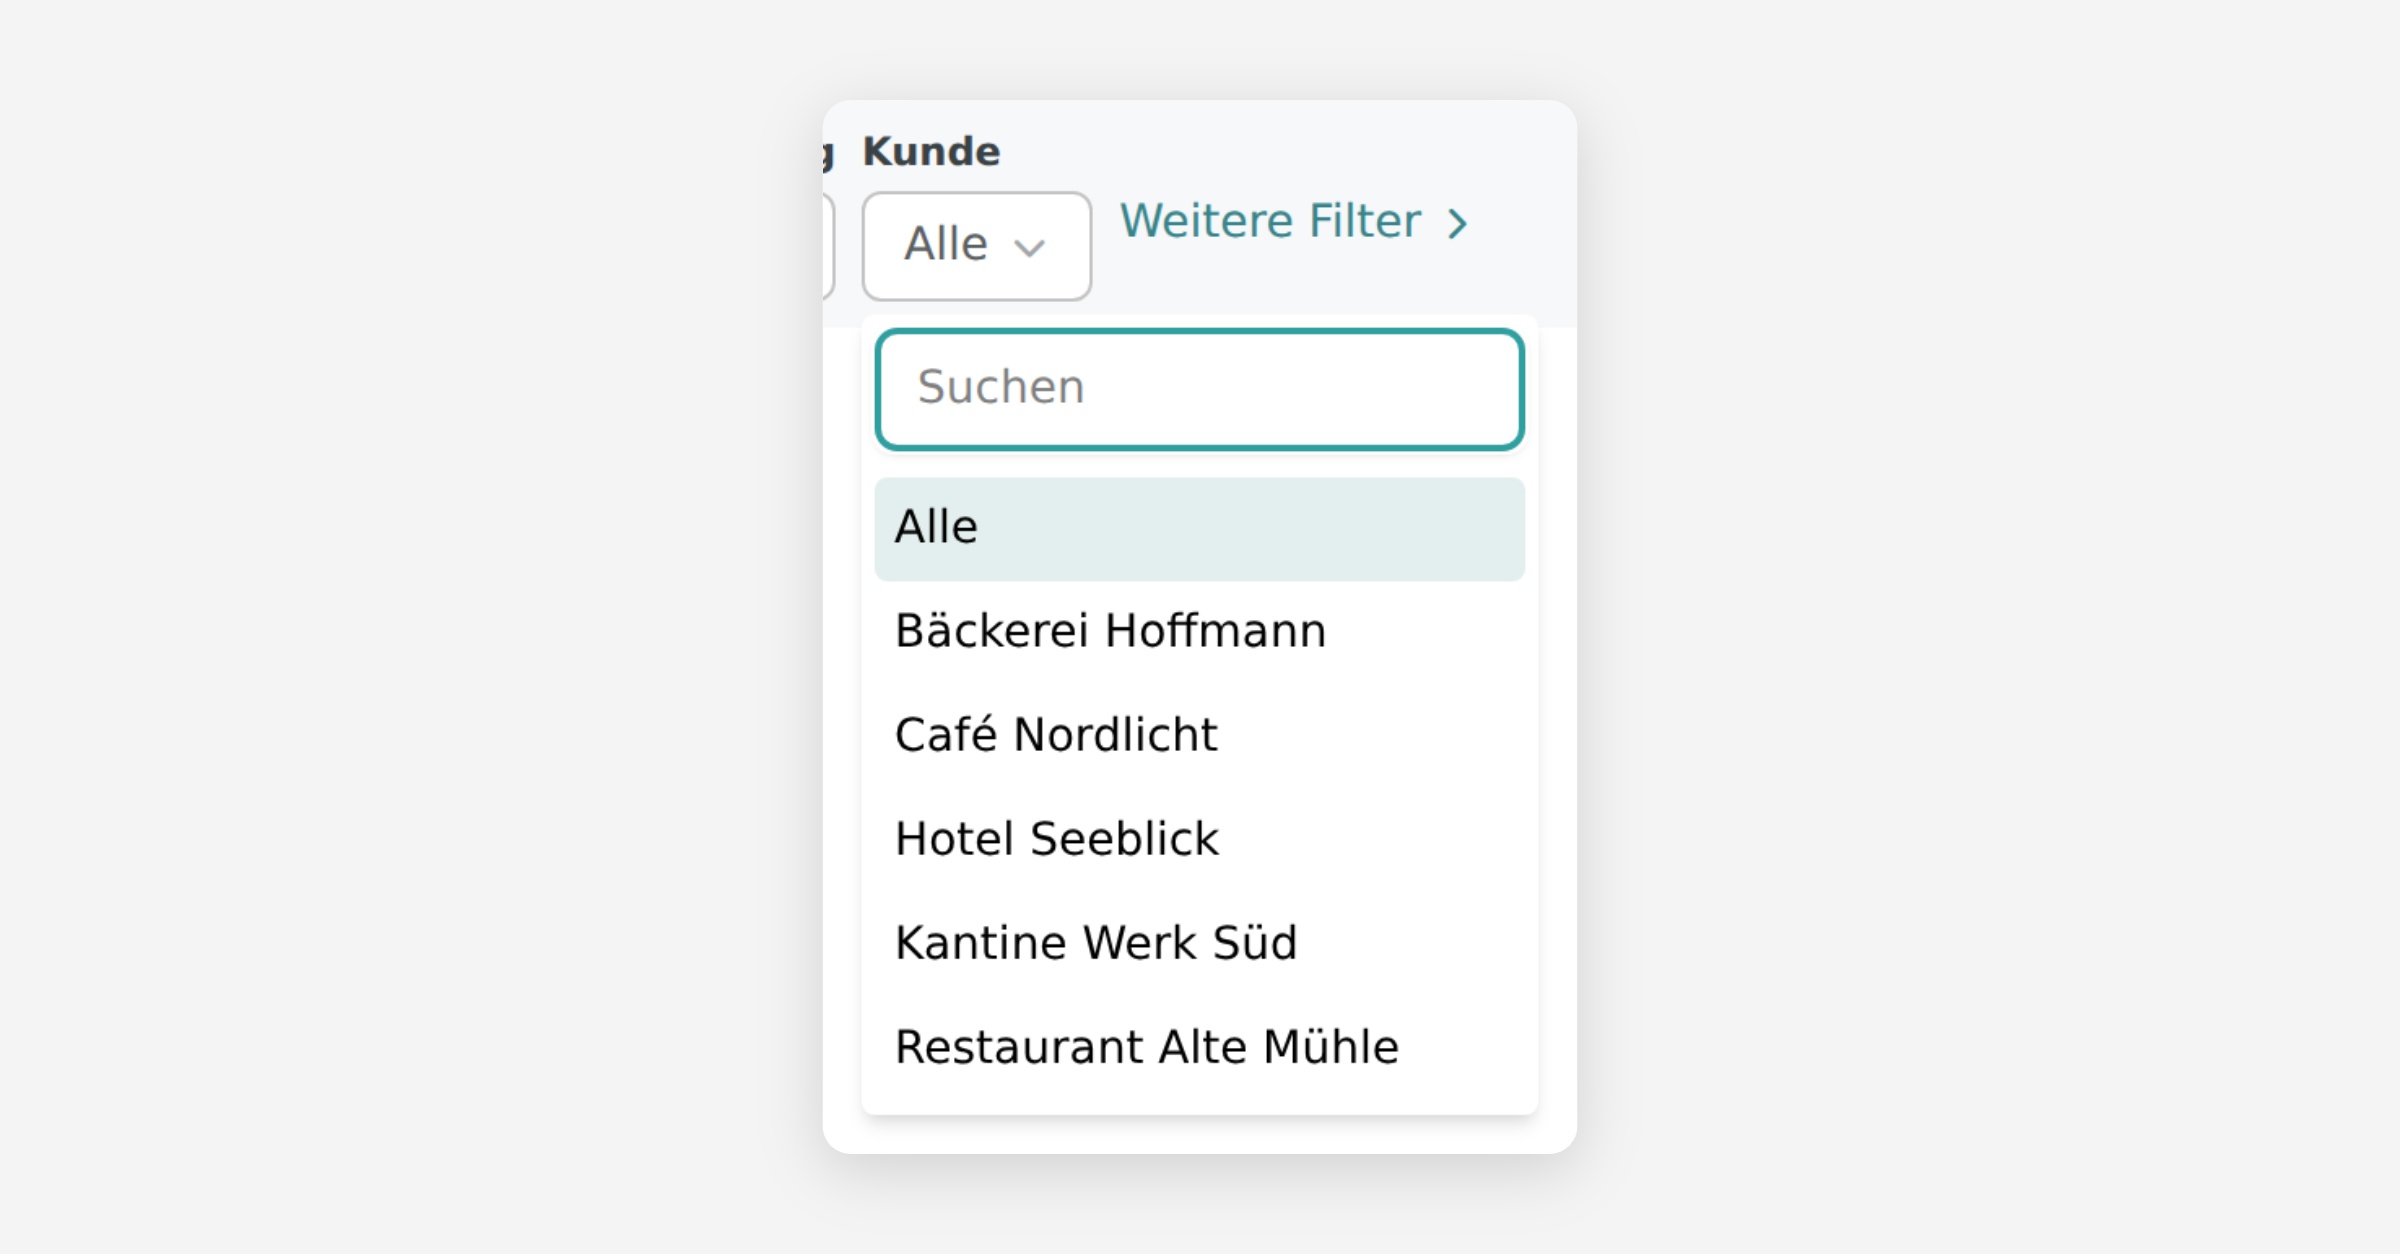
Alle ganz oben löscht den Filter wieder.
Bei einem Pflichtfilter fehlt Alle — dort steht „Bitte auswählen", bis du dich entschieden hast.
Bei Filtern, die aufeinander abgestimmt sind, berücksichtigen die Vorschläge deine übrige Auswahl: Hast du oben eine Filiale gewählt, siehst du unten nur Werte, die es in dieser Filiale gibt.
Mehrfachauswahl
Hier kannst du mehrere Werte gleichzeitig auswählen. Das Dashboard zeigt dann alle Zeilen, auf die einer der Werte passt.
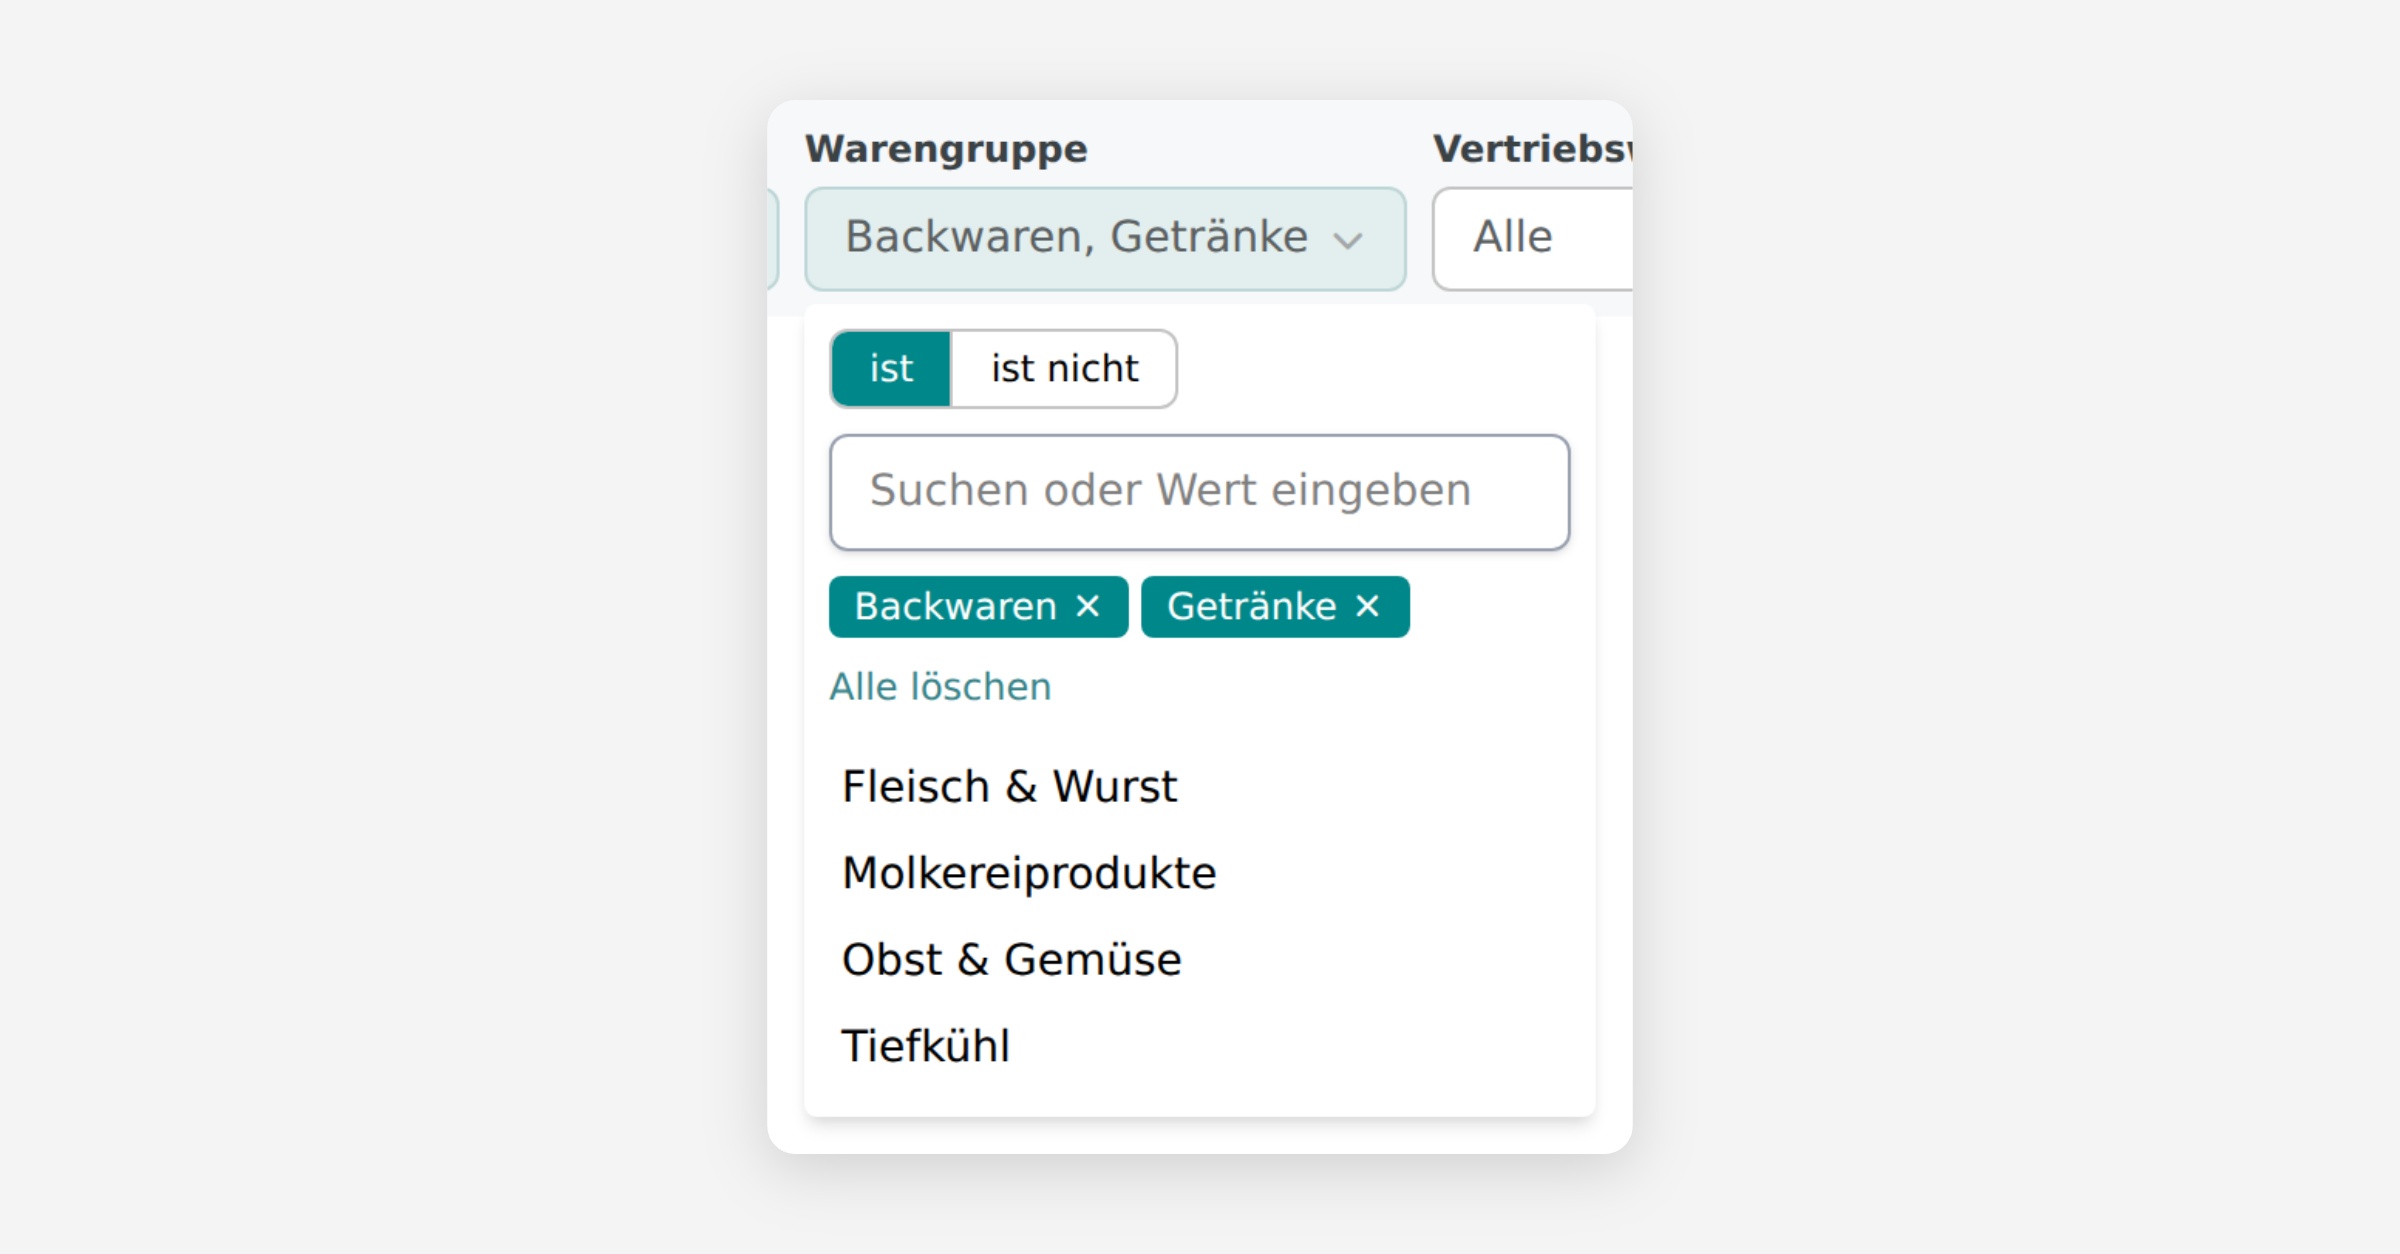
So bedienst du sie:
Tippe in das Suchfeld oder wähle direkt aus der Liste darunter.
Jeder gewählte Wert erscheint als grünes Kärtchen. Ein Klick auf das ✕ entfernt ihn wieder.
Alle löschen entfernt alle Werte auf einmal.
Werte ausschließen
Mit dem Umschalter ist / ist nicht drehst du die Auswahl um. „ist nicht" zeigt alles außer den gewählten Werten. Die Kärtchen werden dann rot und durchgestrichen, die Schaltfläche oben zeigt „nicht: …".
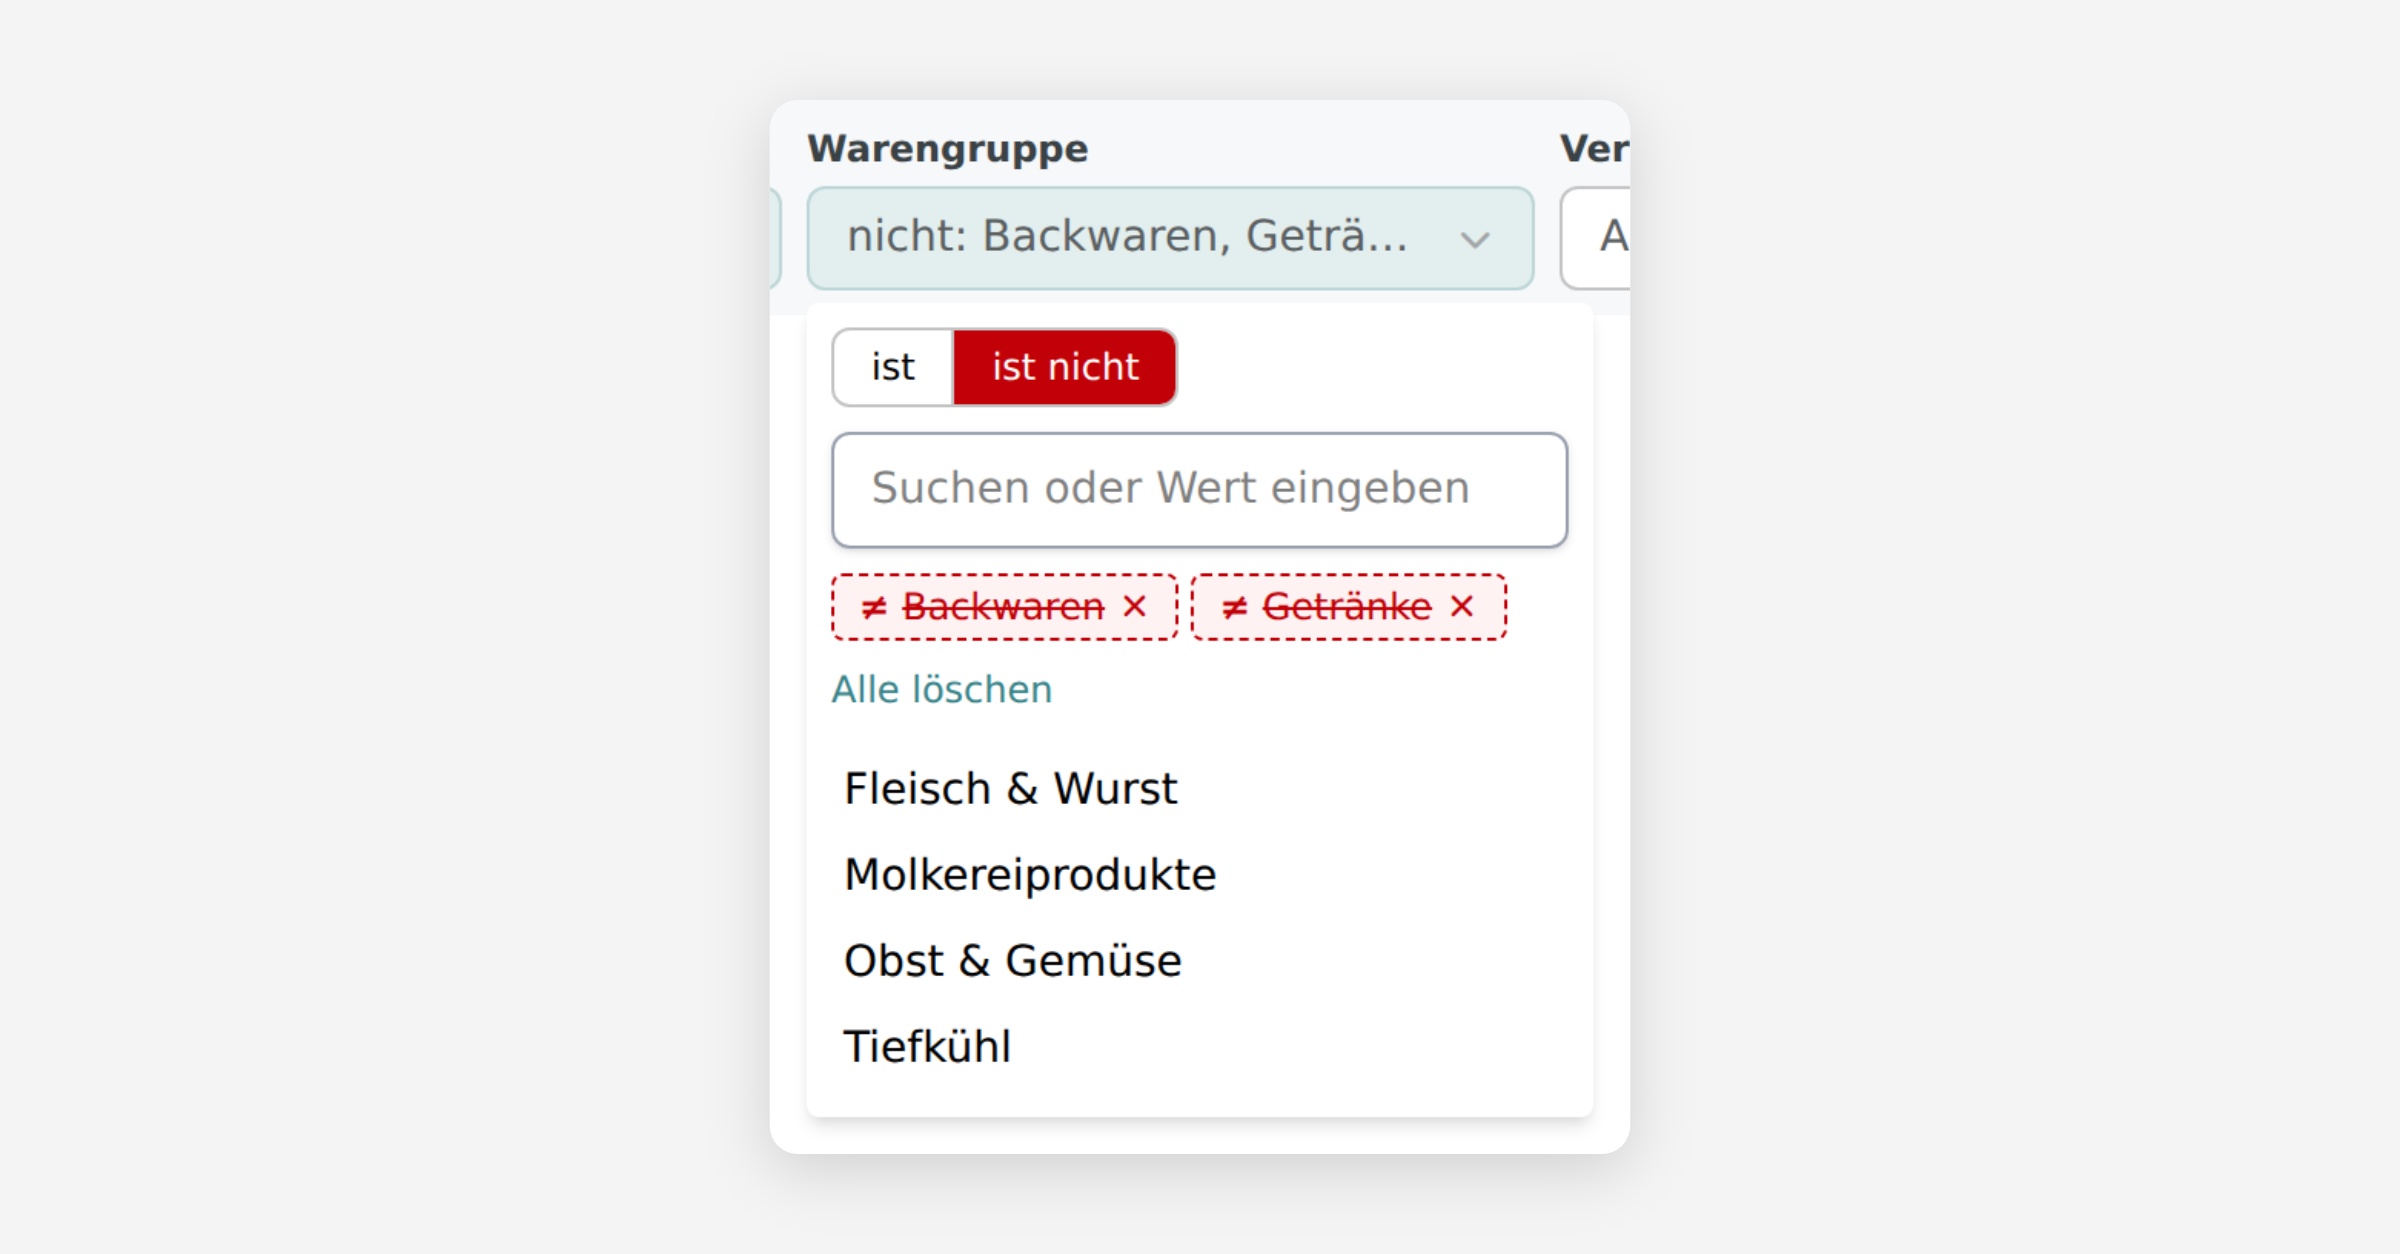
Der Umschalter gilt immer für die ganze Liste — entweder alle Werte einschließen oder alle ausschließen.
Eigene Werte eingeben
Steht ein Wert nicht in der Liste, tippe ihn ein und drücke Enter. Die Plattform sucht dann nach Einträgen, die diesen Text enthalten. „burg" findet also Hamburg, Würzburg und Burgdorf.
Für genauere Suchen kannst du selbst Platzhalter setzen:
Eingabe | Findet |
|---|---|
| alles, was „burg" enthält |
| alles, was mit „Ham" beginnt |
| alles, was auf „burg" endet |
| alles außer „Berlin Mitte" |
Zahlenfilter
Filter auf Zahlen (Umsatz, Menge, Anzahl) sind einfache Eingabefelder. Trage einen Wert ein — das Dashboard zeigt dann die Zeilen mit genau diesem Wert.
Pflichtfilter
Manche Dashboards brauchen zwingend eine Auswahl, zum Beispiel eine Filiale. Solche Filter erkennst du am roten Stern hinter der Überschrift.
Klickst du auf Anwenden, ohne einen Wert gesetzt zu haben, passiert Folgendes:

Das Dashboard bleibt so stehen, wie es ist.
Unter dem betroffenen Filter steht Auswahl erforderlich.
Liegt der Filter hinter „Weitere Filter", klappt die Plattform den Bereich automatisch auf, damit du den Hinweis siehst.
Sobald du einen Wert wählst, verschwindet der Hinweis und du kannst anwenden.
Weitere Filter
Damit die Leiste übersichtlich bleibt, liegen selten gebrauchte Filter hinter Weitere Filter ›. Ein Klick klappt sie in derselben Zeile auf; aus der Beschriftung wird ‹ Weniger Filter.

Ausgeklappt oder nicht — diese Filter wirken genauso wie alle anderen. Ein Wert, den du dort gesetzt hast, gilt auch dann, wenn der Bereich wieder zugeklappt ist.
Crossfilter
Wenn du in einer Kachel des Dashboards auf einen Balken, einen Punkt oder eine Tabellenzeile klickst, filtern sich die übrigen Kacheln auf diesen Wert. Das ist ein Crossfilter.
Crossfilter erscheinen als runde Kärtchen unter der Filterleiste, damit du jederzeit siehst, warum die Zahlen kleiner geworden sind.

Mit Crossfilter zurücksetzen entfernst du sie alle auf einmal. Deine normalen Filter bleiben dabei erhalten.
Auf dem Handy
Auf kleinen Bildschirmen ist die Filterleiste zugeklappt, damit das Dashboard den ganzen Platz hat. Über die Schaltfläche Filter öffnest du sie als Vollbild.
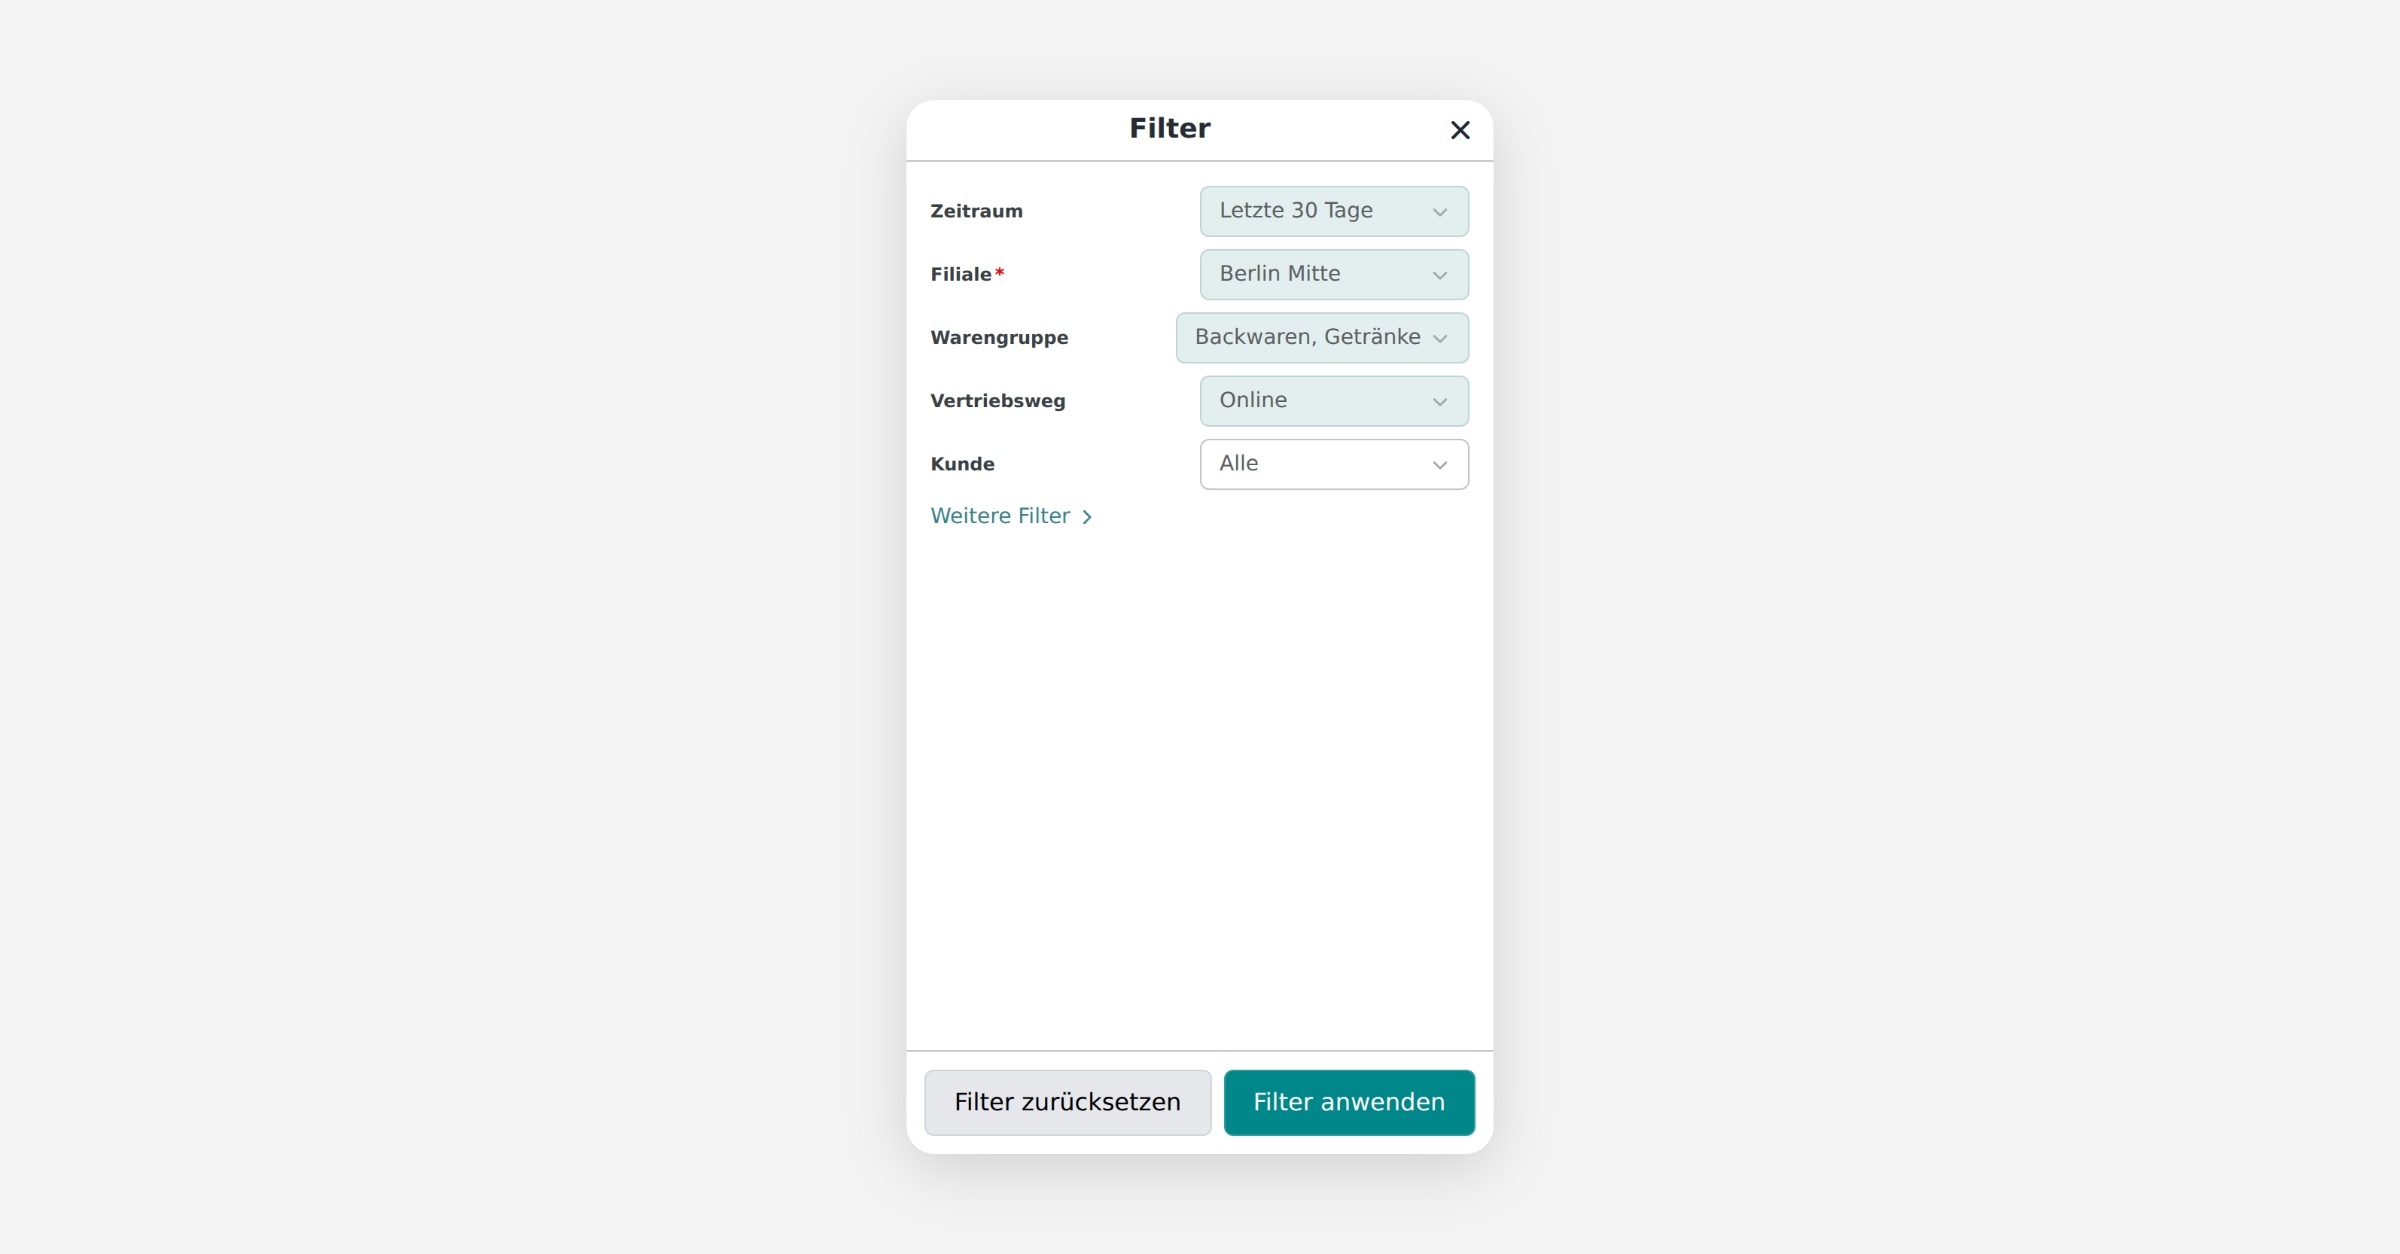
Unten liegen Filter zurücksetzen und Filter anwenden.
Das ✕ oben rechts schließt die Filter wieder, ohne etwas anzuwenden.
Nach dem Anwenden schließt sich die Ansicht automatisch, damit du das Dashboard laden siehst.
Öffnest du einen einzelnen Filter, füllt auch er den Bildschirm:
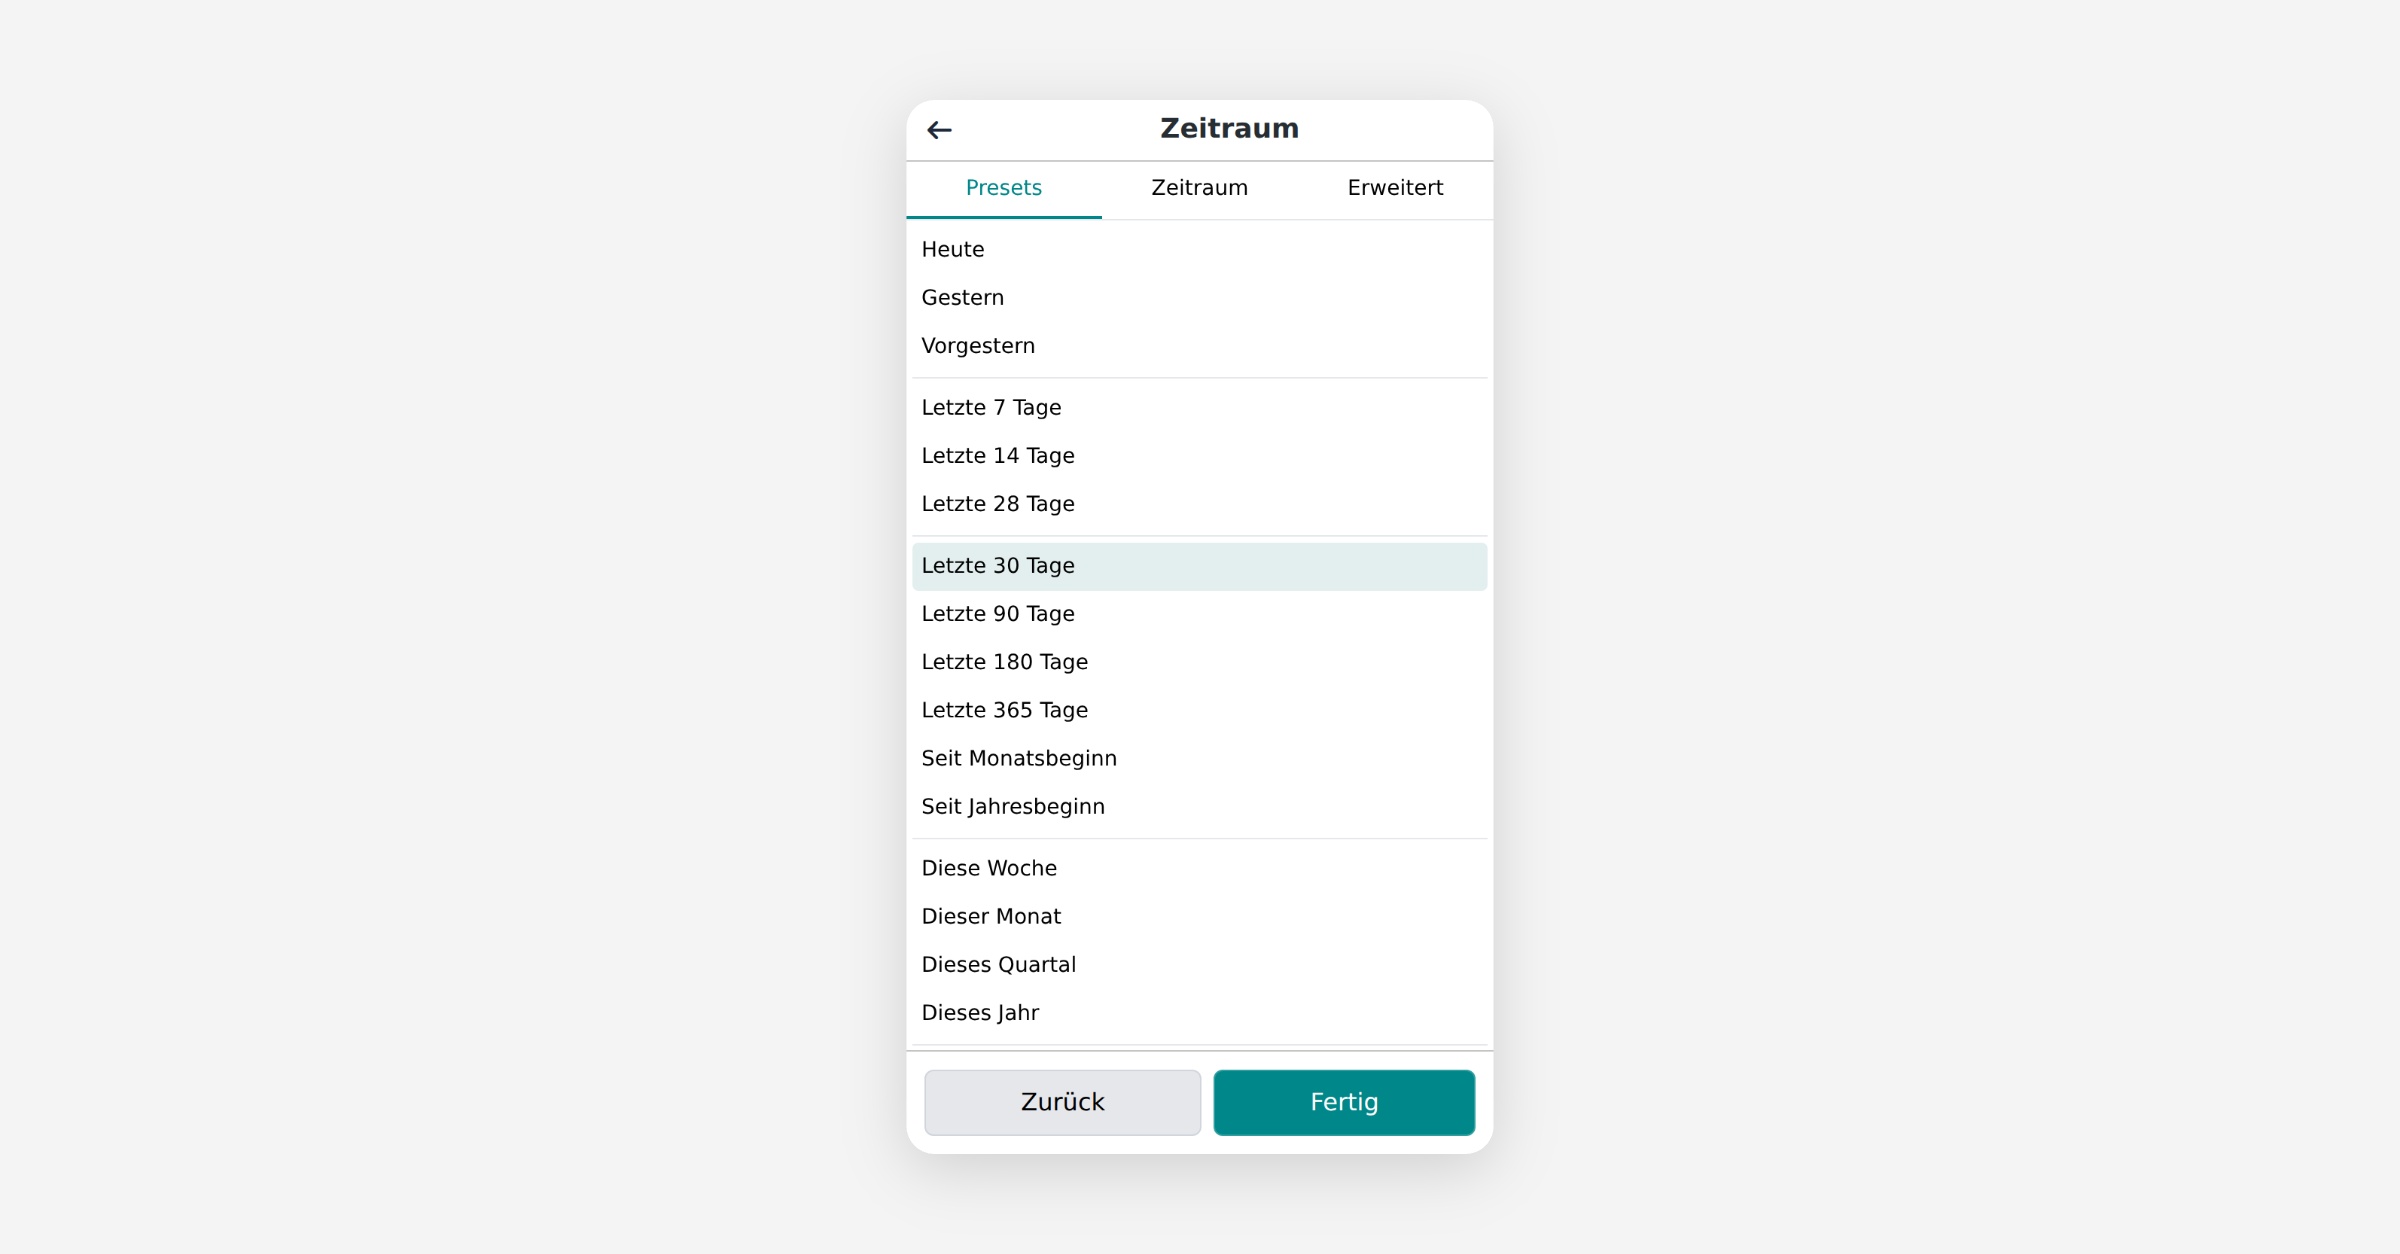
Hier gilt: Fertig übernimmt deine Auswahl, der Pfeil nach links und Zurück verwerfen sie. Am Rechner ist das anders — dort wirkt jede Auswahl sofort im Filterfeld.
Häufige Fragen
Ich habe einen Filter geändert, aber das Dashboard zeigt dieselben Zahlen.
Klicke auf das Aktualisieren-Symbol oben rechts. Solange es türkis ist, sind deine Änderungen noch nicht angewendet.
Wie komme ich zurück auf den Ausgangszustand?
Über das Drei-Punkte-Menü → Filter zurücksetzen. Das Dashboard startet dann wieder mit den hinterlegten Standardwerten.
Das Auswahlfenster schließt sich, wenn ich ins Dashboard klicke.
Das ist so gewollt: Ein Klick außerhalb des Fensters schließt es. Esc tut dasselbe.
Ein Filter zeigt keine Vorschläge.
Manche Felder geben keine Werte zur Auswahl frei. Du kannst den Wert dann von Hand eintippen und mit Enter übernehmen. Bleibt die Liste unerwartet leer, melde dich bei uns — wir können nachsehen, woran es liegt.
Ein Filter, den ich kenne, ist verschwunden.
Filter, die für deine Marke nicht übersetzt oder nicht freigegeben sind, werden ausgeblendet. Sprich uns an, wenn du ihn brauchst.
Mein Wert hat ein Leerzeichen am Ende — zählt das?
Ja. Leerzeichen am Anfang und Ende eines Werts bleiben erhalten und werden genau so gesucht.
War das hilfreich?