
sell & pick changelog
Changelog
The latest sell & pick releases and improvements.
By continuing, you agree to our T&C and Privacy Policy.
Smarta now reads your dashboards and sets up reports
Smarta can now work with your existing sell & pick dashboards. You ask for a dashboard, Smarta sets the right filters and shows you the charts right in the chat. That saves you the trip to the dashboard page.
Dashboards right in the chat
Ask, for example: "Show me the Performance dashboard for Berlin, last week." Smarta opens the dashboard, sets store and time period in the filter bar and shows you bars, KPIs and tables as a chart in the chat. The numbers are the same as in the dashboard, because Smarta uses its exact queries.
Set up reports via chat
"Send me the product group dashboard as a PDF every Monday at 7 am." That's all it takes. Smarta creates the report, with filters, schedule and format (PDF, CSV or Excel). If you want, a test email goes to you right away. You can pause, change or cancel existing reports, also via chat.
More control in the chat
Stop: While Smarta is working, the send button turns into a stop button. One click stops Smarta right away. With
Weiterit carries on after that.Reasoning: You can now see how Smarta got to an answer with the brain icon under the answer.
Your data stays protected: Smarta sends reports only to you and does not change any dashboards that sell & pick maintains for you. We explain exactly what happens with your data here: Data processing at Smarta
All details: Using dashboards with Smarta Setting up reports with Smarta · Using the Smarta chat
View guest feedback via re:spondelligent
Konnektoren
With the re:spondelligent integration, businesses can view their guest reviews directly alongside their operational figures in sell & pick. The platform connects all the common review portals. This shows whether, for example, worse reviews overlap with service bottlenecks, too few staff hours or falling productivity.
What for?
One overall picture of guest feedback and operating data instead of single, isolated numbers.
Reviews from several platforms, especially TripAdvisor; Google stays connected separately.
Key figures like average rating, number of reviews, guest sentiment, response rate and re:spondelligent Score.
Early detection of quality problems: "Are the ratings falling because staffing gets tight at peak times?"
Better conversations with business managers, because concrete causes can be discussed instead of gut feeling.
If you already use re:spondelligent and want to integrate the data into your sell & pick environment, contact your person in CSM. [email protected]
Filter more easily and quickly (also on mobile)
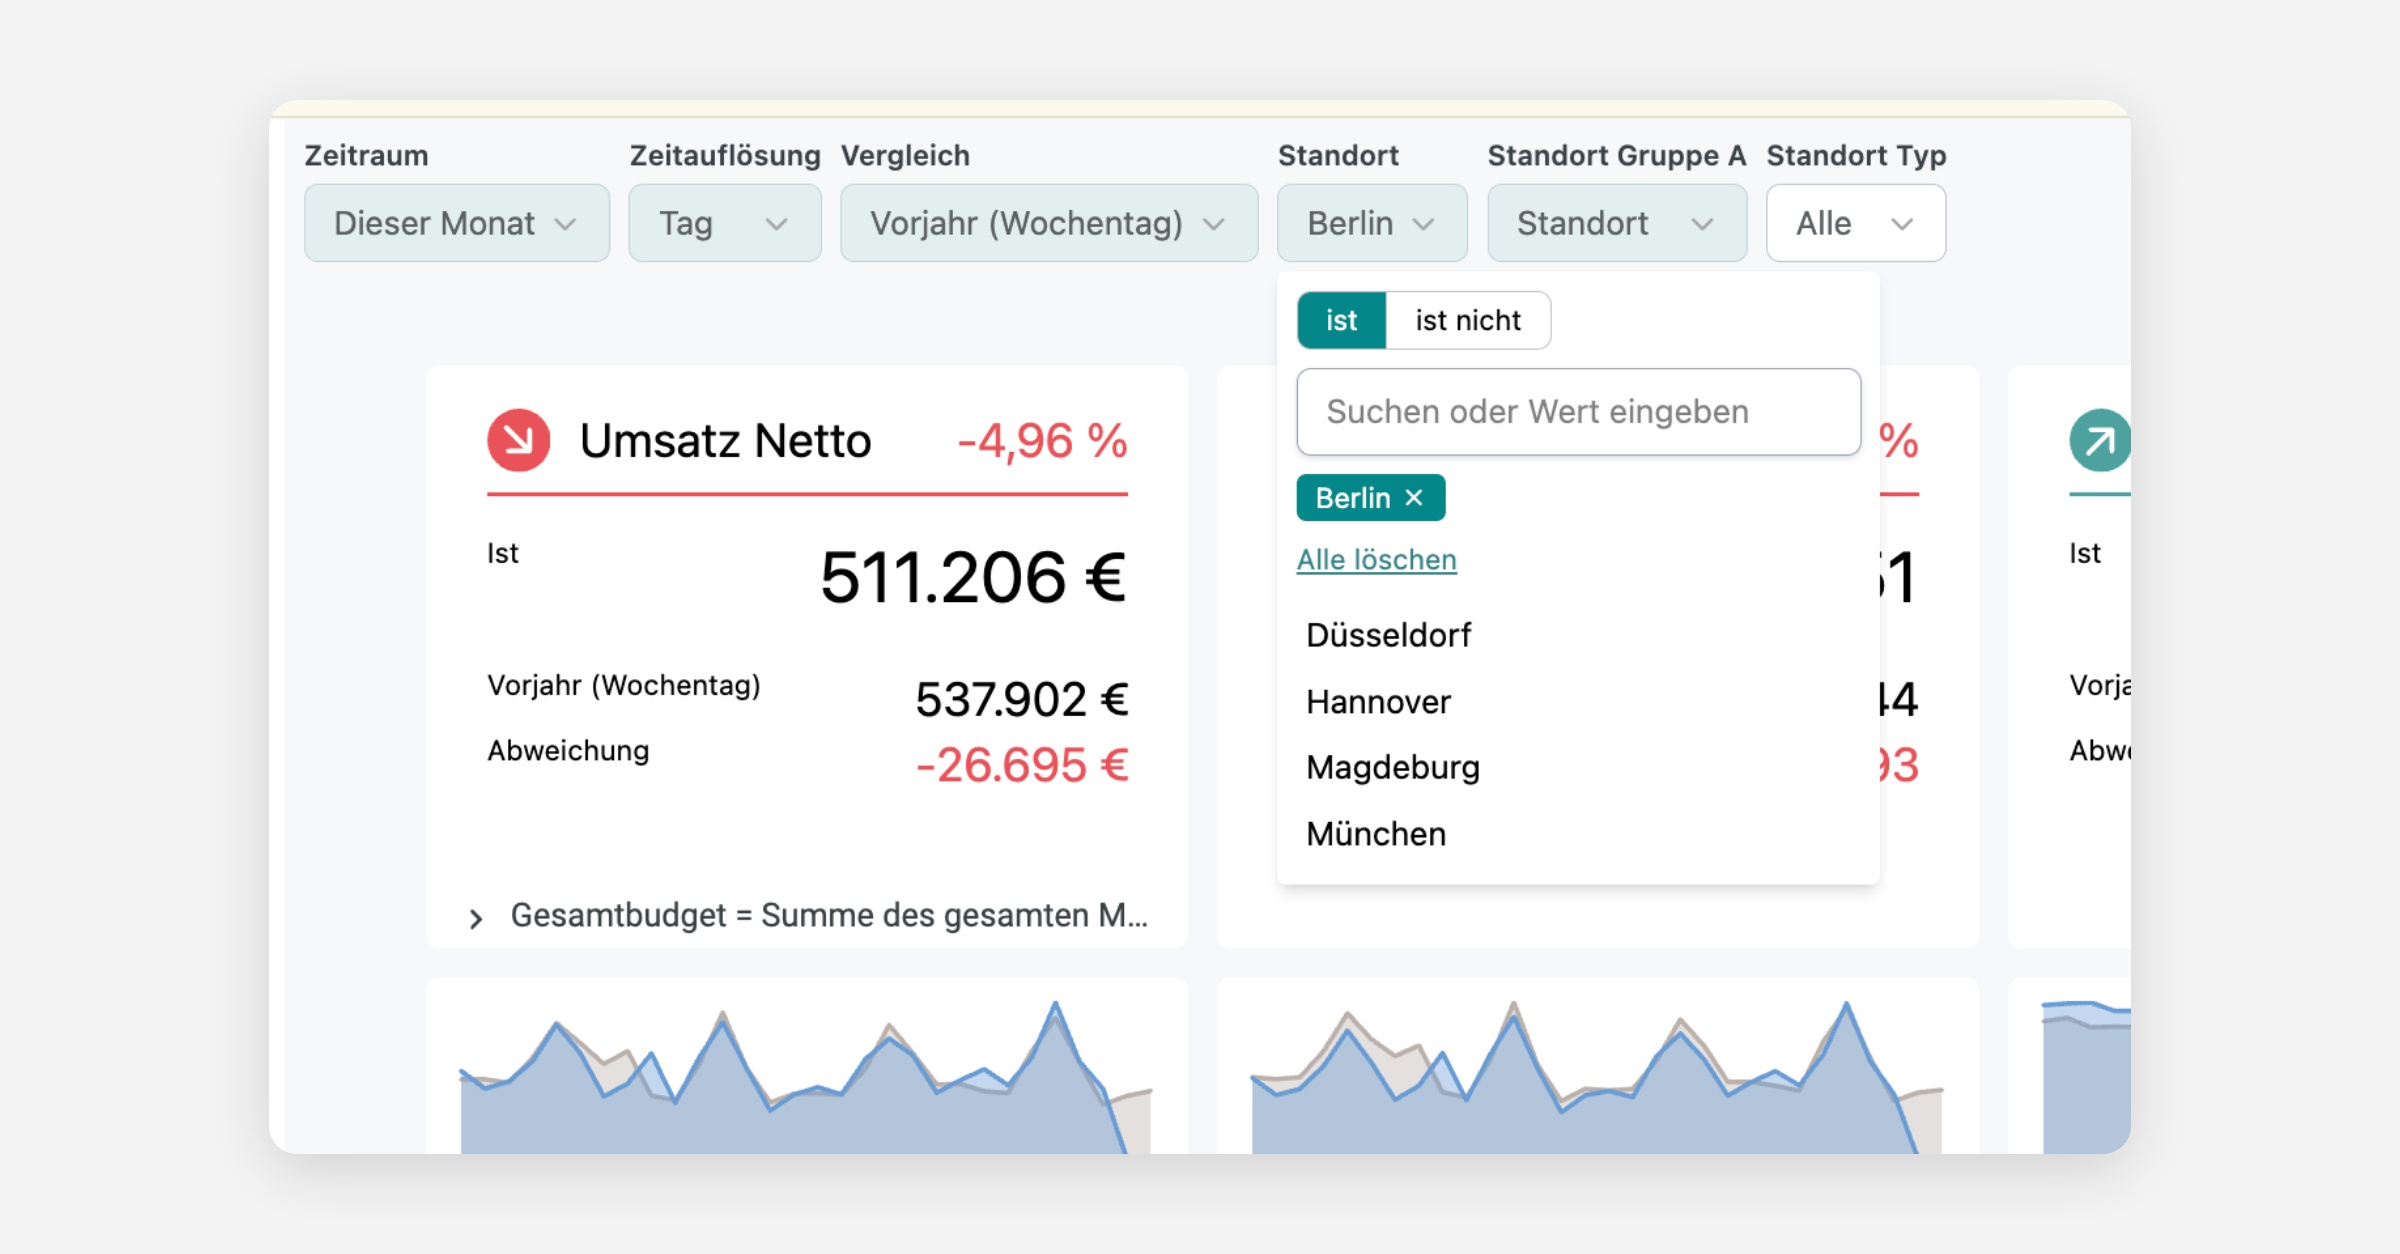
With the new filter bar, you can put together dashboard data more precisely and share your selection directly by link. You can find all info here: Filtering in dashboards
Apply filters faster
The filters are at the top of the dashboard. You can select a time period, branch, or product group and adjust several filters one after another.
Your changes are only applied after a click on the refresh icon. On your phone, use
Filter anwendenfor this.
Active filters at a glance
Fields highlighted in green show active filters. A white field with Alle does not limit the data. You can spot required filters by the red star.
Use Weitere Filter › to open more filters. The three-dot menu also contains Filter zurücksetzen to work with the dashboard's starting values again.
Share selection
Your filter selection is in the browser address. Copy the link to share a dashboard with this exact selection.
Gradual rollout
We are rolling out the new filter bar gradually. If your dashboards still look different and you want to use the feature earlier, contact us.