
sell & pick changelog
Custom dashboards: build your own reports yourselves
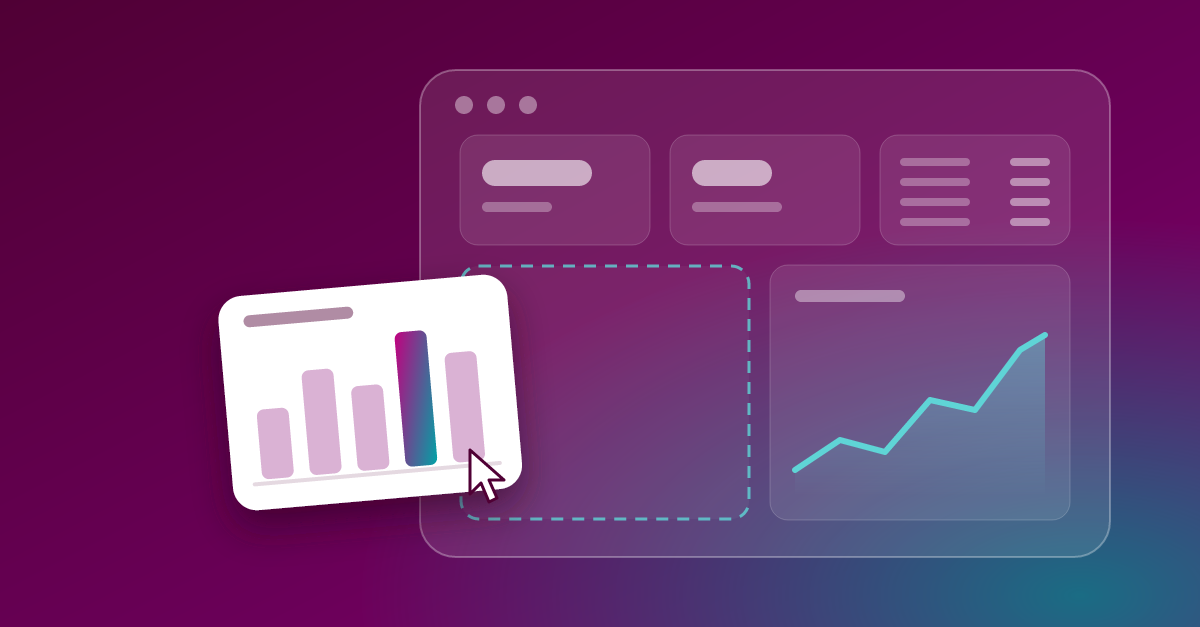
You want a weekly overview just for your branches, a table with the top items, or three KPIs at a glance? From now on you build dashboards like that yourselves. You pick the metrics, chart type and layout, no ticket to us needed.
Your own dashboard in a few clicks
Open an Explore, switch to the Dashboards tab and click Neues Dashboard. Then you add chart after chart: columns, bars, tables, KPIs, multi-value charts or text as a subheading. You set width and height per chart, and the dashboard is 24 columns wide. With the filter bar you decide what viewers can filter themselves, e.g. branch and time period.
Or just ask Smarta
"Build me a dashboard with the revenue per branch for the last 4 weeks and a table with the top 10 items." Smarta creates the dashboard, adds the charts and sends you the link. After that you can keep refining it by chat or by hand. A chart that Smarta shows you in the chat goes into your dashboard with one sentence.
Share, download, send
New dashboards are private at first. When you're ready, you share them with groups from your brand. You download the whole dashboard as PDF, CSV or Excel, and single charts also as PNG for your next presentation. And as with all dashboards, you get it by email on a regular basis via Neuer Report.
Activation
We activate custom dashboards per data source. If you don't see the
Smarta Dashboardstab yet, talk to your Customer Success Manager or write to [email protected].
You can find all the guides in the new section Eigene Dashboards.